
Collision theory and rates of reaction
Rate of reaction is defined as the rate of change in concentration
- Rate takes the reciprocal value of time, so is expressed per unit time or in SI units per second (symbol = s–1). Rate = 1/ time = 1/s = s–1.
- As the reaction proceeds, reactants are converted into products, and so the concentration of reactants decreases as the concentration of products increases.
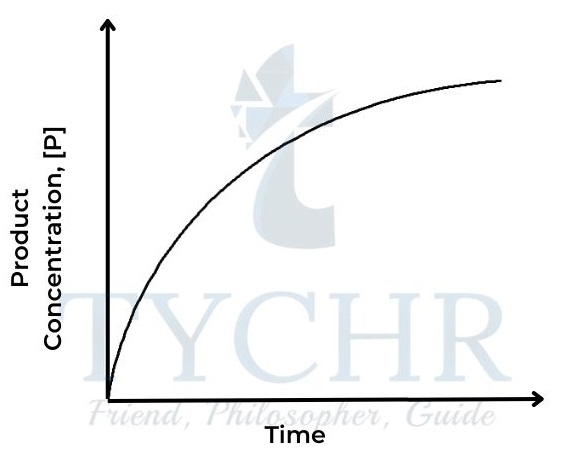
Figure 1: Concentration of product against time 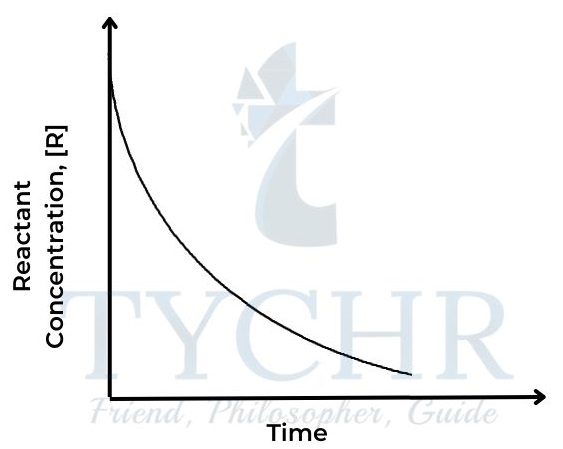
Figure 2: Concentration of reactant against time - The rate of a reaction depends on how quickly the concentration of either reactant or product changes with respect to time. It can be defined as follows:
Rate of reaction = increase in product conc/Time taken
or decrease in reactant conc/time taken - As rate = change in concentration per time, its units are mol dm–3 s–1.
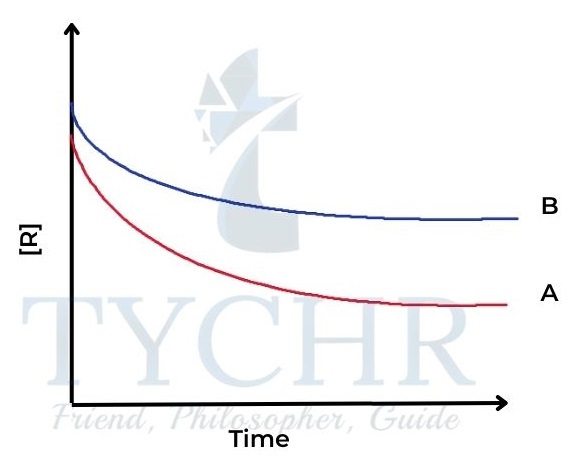
Figure 3: Reactant concentration against time for two different reactions A and B. - We can see that the concentration of reactants is decreasing more quickly in reaction A than in reaction B – the curve is steeper.
- The steepness, or gradient, of the curve is a measure of the change in concentration per unit time, in other words, the rate of the reaction.
Measuring rates of reaction uses different techniques depending on the reaction
- To measure the change in concentration of reactants or products, and the technique with which to measure that change really depends on what is the most convenient for a particular reaction. This is different for different reactions.
- In most cases the concentration is not measured directly, but is measured by means of a signal which is related to the changing concentration.
- If, for example, a reaction produces a coloured precipitate as a product, the change in colour could be measured; if a reaction gives off a gas, then the change in volume or change in mass could be measured.
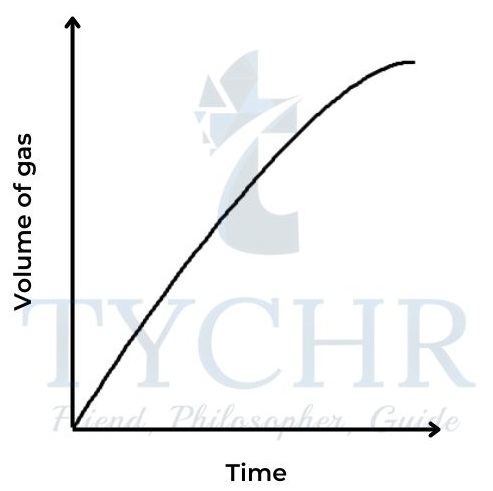
1.) Change in volume of gas produced
- This is a convenient method if one of the products is a gas.
- Collecting the gas and measuring the change in volume at regular time intervals enables a graph to be plotted of volume against time.
Mg(s) + 2HCl(aq) → MgCl2(aq) + H2(g)
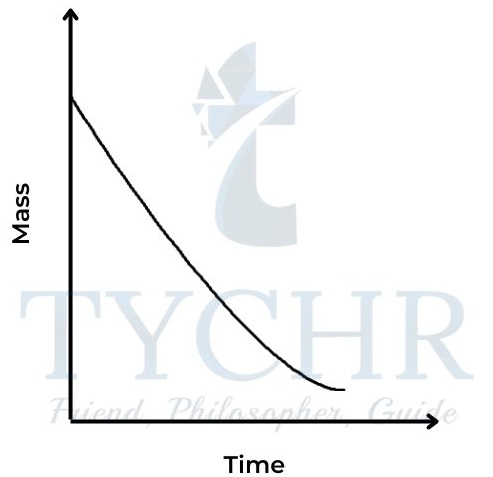
2.) Change in mass
- Many reactions involve a change in mass, and it may be convenient to measure this directly.
- If the reaction is giving off a gas, the corresponding decrease in mass can be measured by standing the reaction mixture directly on a balance.
- The method allows for continuous readings, so a graph can be plotted directly of mass against time.
- For example, the release of carbon dioxide from the reaction between a carbonate and dilute acid can be followed in this way.
CaCO3(s) + 2HCl (aq) → CaCl2(aq) + CO2(g) + H2O(l)
3.) Change in transmission of light: colorimetry/spectrophotometry
- This technique can be used if one of the reactants or products is coloured and so gives characteristic absorption in the visible region (wavelengths about 320–800 nm).
- A colorimeter or spectrophotometer works by passing light of a selected wavelength through the solution being studied and measures the intensity of the light transmitted by the reaction components.
- As the concentration of the coloured compound increases, it absorbs proportionally more light, so less is transmitted.
- A photocell generates an electric current according to the amount of light transmitted and this is recorded on a meter or connected to a computer.
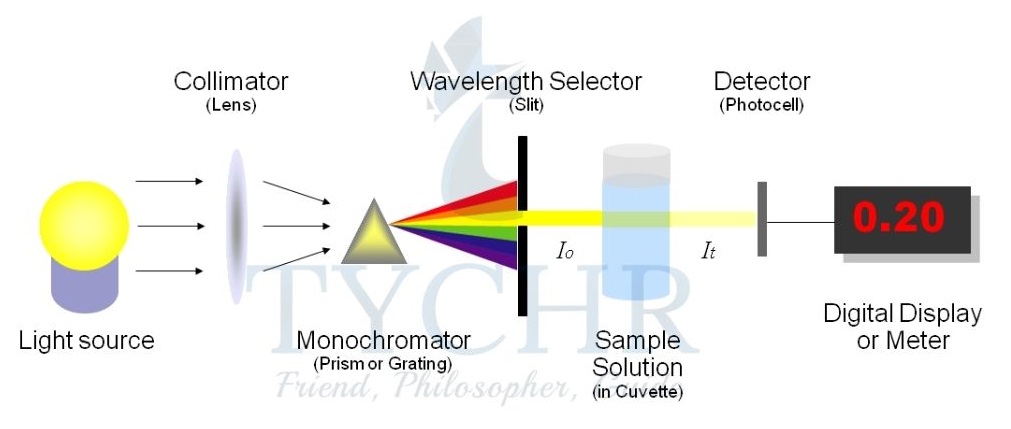
Figure 6: A spectrophotometer measures absorbance, which directly relates to concentration. Light of a specific wavelength is selected from an internal source and passes through the solution placed in the cuvette. The transmitted light passes through a diffraction grating, then the diffracted light is collected and changed into a digital signal by the CCD detector. - For example, the reaction between the dye crystal violet and sodium hydroxide solution can be written in an abbreviated form as follows: CV+ + OH– → CVOH
- The initial crystal violet solution (CV+) is coloured but this slowly changes to a colourless solution as the product (CVOH) is formed.
4.) Change in concentration measured using titration
- In some reactions it may be possible to measure the concentration of one of the reactants or products by titrating it against a known ‘standard’.
- Another technique known as quenching can be used, where a substance is introduced which effectively stops the reaction in the sample at the moment it is withdrawn.
- It is rather like obtaining a ‘freeze frame’ shot of the reaction at a particular interval of time.
- In order to see how concentration changes as the reaction proceeds, it is necessary to repeat this process at several intervals of time.
- For example, the reaction between H2O2 and acidified KI yields I2, which can be titrated against sodium thiosulfate, Na2S2O3 to determine its concentration. Sodium carbonate, Na2CO3, is used to quench the reaction by neutralising the added acid.
H2O2(aq) + 2H+(aq) + 2I–(aq) → I2(aq) + 2H2O(l)
5.) Change in concentration measured using conductivity
- The total electrical conductivity of a solution depends on the total concentration of its ions and on their charges.
- Conductivity can be measured directly using a conductivity meter which involves immersing inert electrodes in the solution.
- For example, in the reaction:
BrO3–(aq) + 5Br–(aq) + 6H+(aq) → 3Br2(aq) + 3H2O(l) - The sharp decrease in the concentration of ions (12 on the reactants side and 0 on the products side) will give a corresponding decrease in the electrical conductivity of the solution as the reaction proceeds.
6.) Non-continuous methods of detecting change during a reaction: ‘clock reactions’
- Sometimes it is difficult to record the continuous change in the rate of a reaction.
- In these cases, it may be more convenient to measure the time it takes for a reaction to reach a certain chosen fixed point – that is, something observable which can be used as an arbitrary ‘end point’ by which to stop the clock.
- the time taken for a certain size piece of magnesium ribbon to react completely with dilute acid, until it is no longer visible:
Mg(s) + 2HCl (aq) → MgCl2(aq) + H2(g) - the time taken for a solution of sodium thiosulfate with dilute acid to become opaque by the precipitation of sulfur, so that a cross viewed through the solution is no longer visible:
Na2S2O3(aq) + 2HCl(aq) → 2NaCl(aq) + SO2(aq) + H2O(l) + S(s)
Kinetic energy and temperature
- The essence of kinetic molecular theory is that particles in a substance move randomly as a result of the kinetic energy that they possess.
- Because of the random nature of these movements and collisions, not all particles in a substance at any one time have the same values of kinetic energy, but will instead have a range of values.
- A convenient way to describe the kinetic energy of a substance is therefore to take the average of these values, and this is directly related to its absolute temperature – that is, its temperature measured in Kelvin.
- As we supply a substance with extra energy through heating it, we raise the average kinetic energy of the particles and so also raise its temperature.
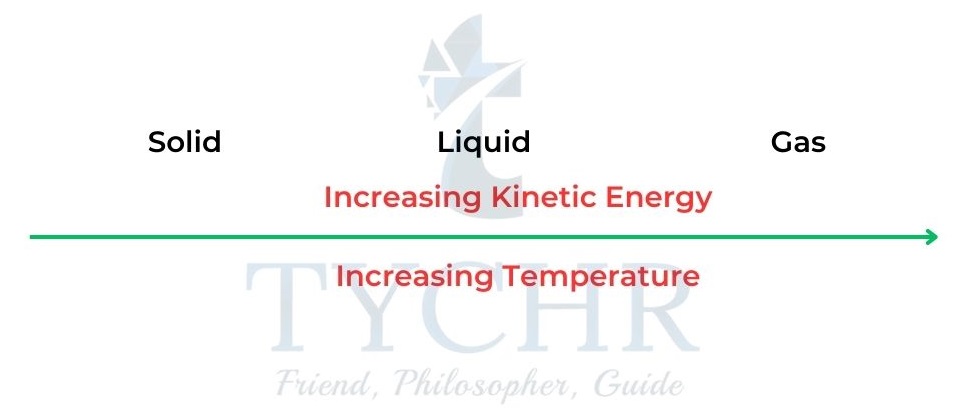
Figure 7: For a given substance this can be summarized
The Maxwell–Boltzmann distribution curve
- The fact that particles in a gas at a particular temperature show a range in their values of kinetic energy is expressed by the Maxwell–Boltzmann distribution curve.
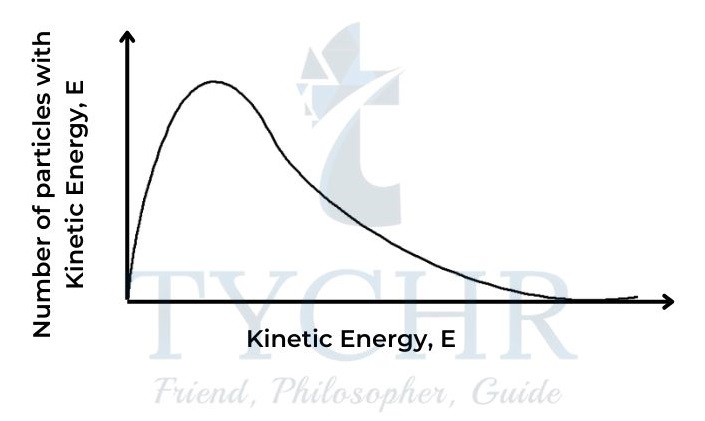
Figure 8: The Maxwell– Boltzmann distribution curve. - Like other distribution curves, this shows the number having a particular value, in this case of particles with a particular value of kinetic energy (or the probability of that value occurring) plotted against the values for kinetic energy. The area under the curve represents the total number of particles in the sample.
How reactions happen
- When reactants are placed together, the kinetic energy that their particles possess causes them to collide with each other.
- The energy of these collisions may result in some bonds between the reactants being broken, and some new bonds forming.
- As a result, products form and the reaction ‘happens’.
- But a very important point is that not all collisions will be successful. There are two main factors that influence this: energy of collision and geometry of collision.
Energy of collision
- In order for a collision to lead to reaction, the particles must have a certain minimum value for their kinetic energy, known as the activation energy, Ea.
- This energy is necessary for overcoming repulsion between molecules, and often for breaking some bonds in the reactants before they can react. When this energy is supplied, the reactants achieve the transition state from which products can form.
- The activation energy therefore represents an energy barrier for the reaction, and it has a different value in different reactions.
- Particles that have a kinetic energy value greater than the activation energy will have successful collisions. Note that particles with lower values of kinetic energy may still collide, but these collisions will not be ‘successful’ in the sense of causing a reaction.
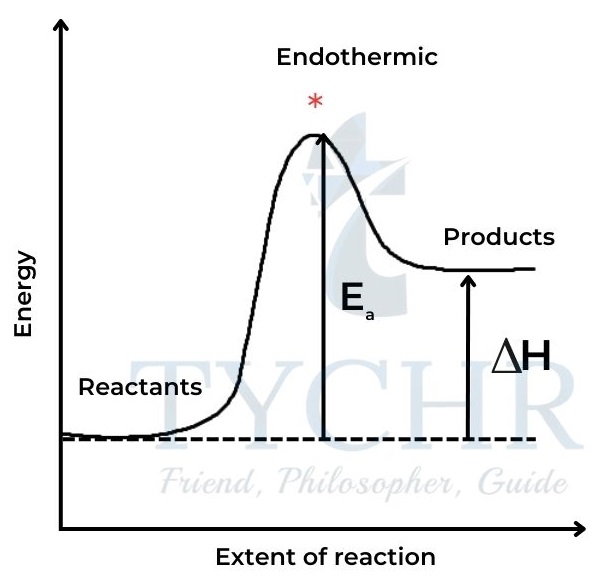

Figure 6: A spectrophotometer measures absorbance, which directly relates to concentration. Light of Figure 9: Energy path of a reaction with the activation energy for (a) endothermic and (b) exothermic reactions. * represents the transition state.a specific wavelength is selected from an internal source and passes through the solution placed in the cuvette. The transmitted light passes through a diffraction grating, then the diffracted light is collected and changed into a digital signal by the CCD detector.
Geometry of collision
- Because collisions between particles are random, they are likely to occur with the particles in many different orientations.
- In some reactions this can be crucial in determining whether or not the collisions will be successful, and therefore what proportion of collisions will lead to a reaction.
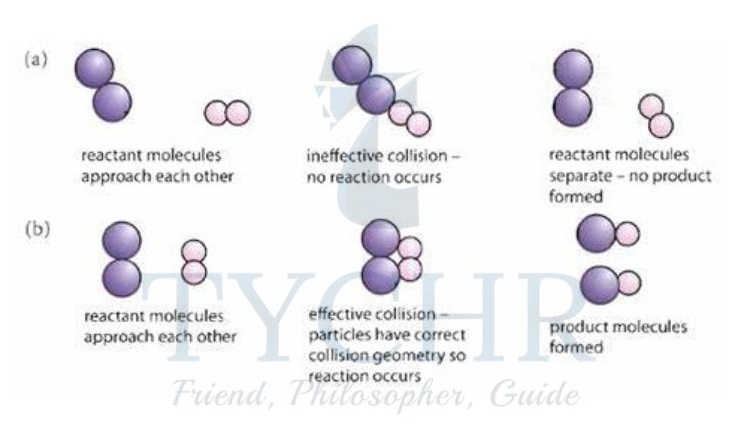
Figure 10: The effect of collision geometry. In (a) the particles do not have the correct collision geometry and no reaction occurs. In (b) the particles collide with the correct geometry, enabling products to form.
Factors affecting rate of reaction
Temperature
- Increasing the temperature causes an increase in the average kinetic energy of the particles. We can see this by comparing Maxwell–Boltzmann distribution curves of the same sample of particles at two different temperatures.
- So, as temperature increases, there is an increase in collision frequency due to the higher kinetic energy, but more importantly there is an increase in the frequency of collisions involving particles with the necessary activation energy to overcome the activation energy barrier.
- Consequently, there is an increase in the frequency of successful collisions and so an increase in the rate of reaction.
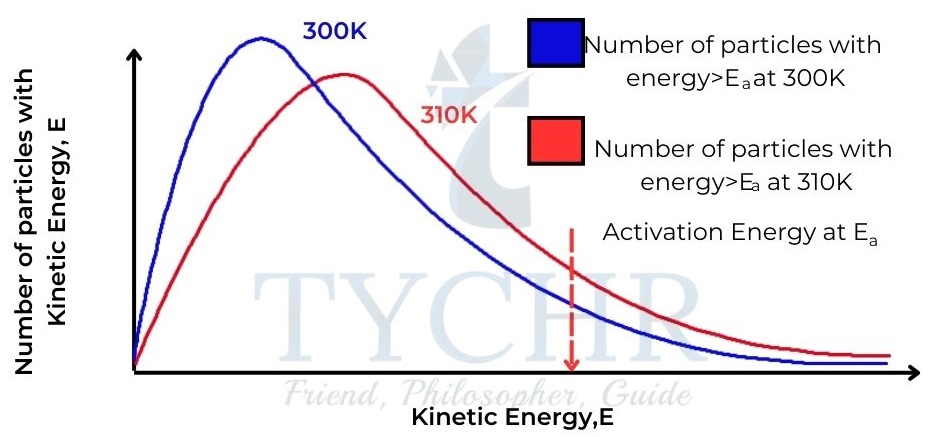
Figure 11: Maxwell– Boltzmann distribution curves for a sample of gas at two different temperatures, showing the higher proportion of particles with kinetic energy greater than the activation energy at the higher temperature.
Concentration
- Increasing the concentration of reactants increases the rate of reaction.
- This is because as concentration increases, the frequency of collisions between reactant particles increases, as shown in Figure 12. The frequency of successful collisions therefore increases too.
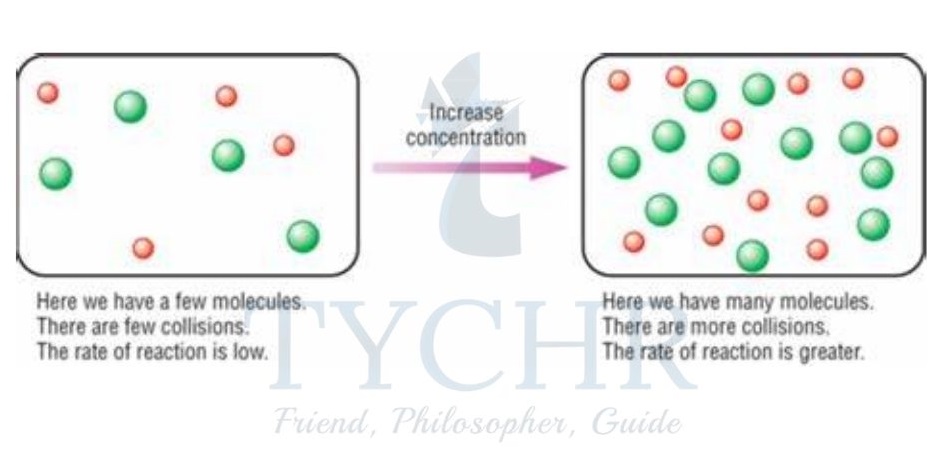
Figure 12: Effect of concentration on collision frequency.
Particle size
- Decreasing the particle size increases the rate of reaction.
- This is important in heterogeneous reactions where the reactants are in different phases, such as a solid reacting with a solution.
- Subdividing a large particle into smaller parts increases the total surface area and therefore allows more contact and a higher probability of collisions between the reactants.
Pressure
- For reactions involving gases, increasing pressure increases the rate of reaction.
- This is because the higher pressure compresses the gas, effectively increasing its concentration.
- This will increase the frequency of collisions.
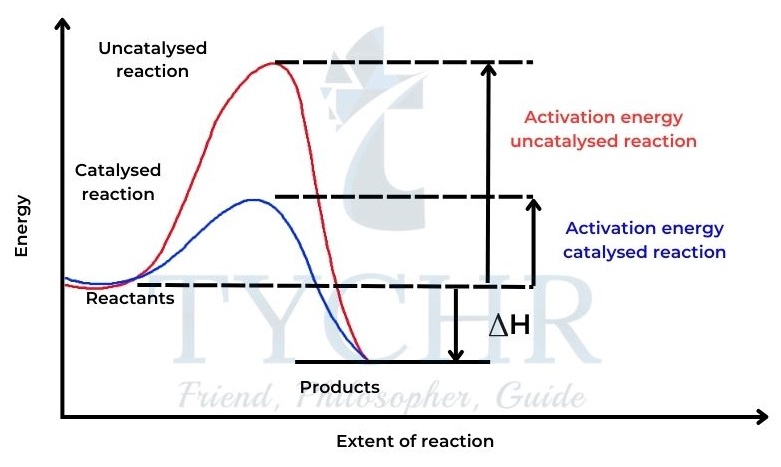
Catalyst
- A catalyst is a substance that increases the rate of a chemical reaction without itself undergoing permanent chemical change.
- Most catalysts work by providing an alternate route for the reaction that has a lower activation energy.
- This means that without increasing the temperature, a larger number of particles will now have values of kinetic energy greater than the activation energy, and so will be able to undergo successful collisions.
Rate expression and reaction mechanism
Rate equation
- Rate equation can be defined as the mathematical differential expression that expresses rate in terms of concentration. For example, consider the reaction: xA + yB → qC + pD
where x, y, q, and p are the stoichiometry coefficients.
- The rate equation is expressed as follows: rate
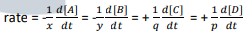
- rate = k[A]m[B]n where: k = rate constant
- The overall order of the reaction is then defined as the sum of the m and n exponents: overall reaction order = m + n
Catalysts
- A catalyst is a substance that increases the rate of a chemical reaction, but is not consumed in the reaction itself.
- A catalyst provides an alternative pathway for the reaction and lowers the activation energy, Ea.
- The first catalyst used in industry was for the production of sulfuric acid.
- In this process, called the contact process, elemental sulfur, S(s), is first reacted with oxygen gas, O2(g), to form sulfur dioxide gas, SO2(g): S(s) + O2(g) → SO2(g)
- Sulfur dioxide then reacts with oxygen gas to produce sulfur trioxide, SO3(g): 2SO2(g) + O2(g) →V2O5(s) 2SO3(g).The catalyst used is vanadium(V) oxide, V2O5(s), which is a heterogeneous catalyst.
Molecularity and rate-determining step (slow step) of a reaction
- The sequence of reaction steps outlining the reaction pathway from reactants to the formation of products is a very important aspect of chemical kinetics.
- This sequence of events is termed the reaction mechanism. In a reaction mechanism any individual step is described as an elementary step or elementary reaction or elementary process.
- In turn, an elementary step is classified by its molecularity, which represents the number of molecules or atoms involved as reactants in the elementary reaction:
unimolecular: single molecule involved in an elementary step
bimolecular: two molecules or atoms involved in collision in an elementary step
termolecular: three molecules or atoms involved in collision in an elementary step. - Each elementary step has its own rate constant, k, and its own activation energy, Ea.
- Let’s return to the reaction of nitrogen dioxide with carbon monoxide: NO2(g) + CO(g) → NO(g) + CO2(g)
- The reaction mechanism representing the sequence of molecular events leading from reactants to products is actually composed of two elementary steps:
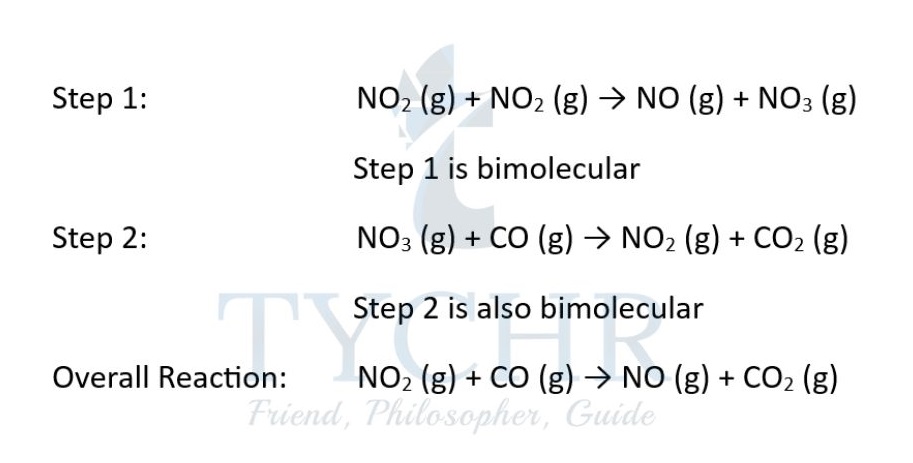
- In this mechanism, NO3(g) is described as a reaction intermediate, as it is formed in step 1 and then is consumed subsequently in step 2.
- Therefore, reactions may occur by more than one step and the slow step determines the rate of the reaction. The slow step is termed the rate-determining step (RDS).
Deduction of a rate equation from a proposed reaction mechanism
- In order to deduce the rate equation from a proposed reaction mechanism:
- (1) Decide on which step is the RDS. The rate of the overall reaction is equal to the rate of this slow step.
- (2) From (1) deduce the rate equation for the RDS.
- Consider step 1 as the slow step (so is the RDS) and step 2 as the fast step:
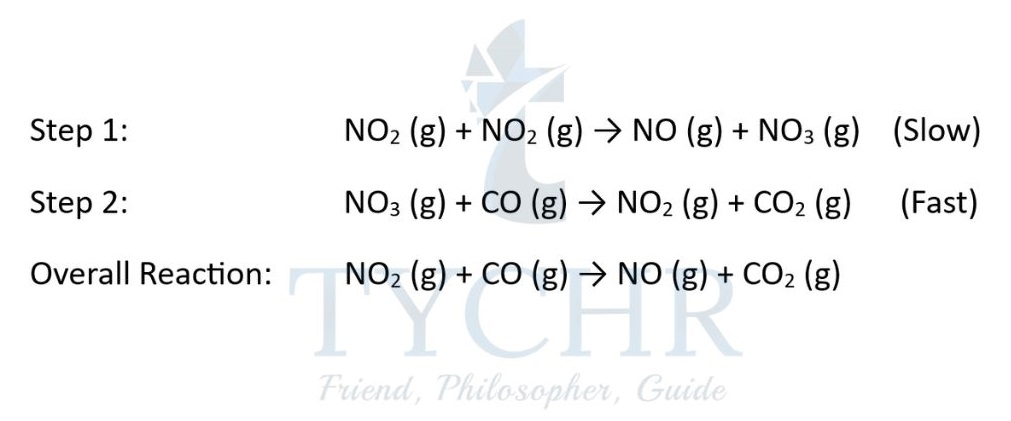
- Rate of overall reaction = rate of the slow step (in this case step 1) = k[NO2]2.
Graphical representations of reaction kinetics
- Here we will investigate reactions where the order with respect to a particular reactant is zero, first, or second.
- In more complex reactions, other values for order are possible, including fractional and negative values.
Zero-order reaction
- Here the concentration of reactant A does not affect the rate of the reaction. Rate = k [A]0 or rate = k.
- So the concentration–time graph is a straight line, showing a constant rate (Figure 14). The gradient of the line = k. The rate–concentration graph is a horizontal line (Figure 15).
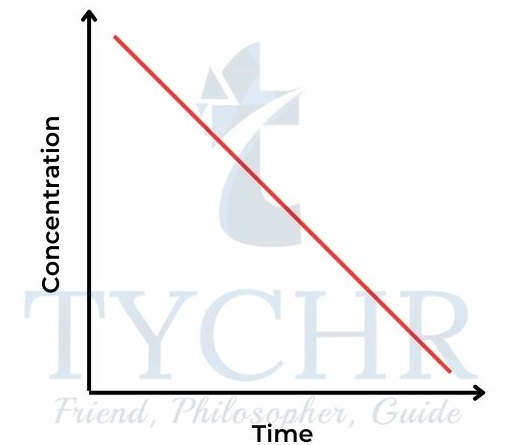
Figure 14: Concentration–time graph for a zeroorder reaction. 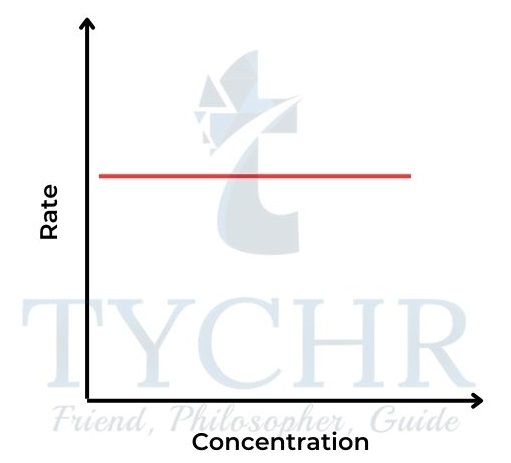
15: Rate–concentration graph for a zeroorder reaction.
First-order reaction
- Here the rate is directly proportional to the concentration of A. Rate = k [A].
- So the concentration–time graph is a curve showing rate decreasing with concentration (Figure 16); the rate–concentration graph is a straight line passing through the origin with gradient k (Figure 17).
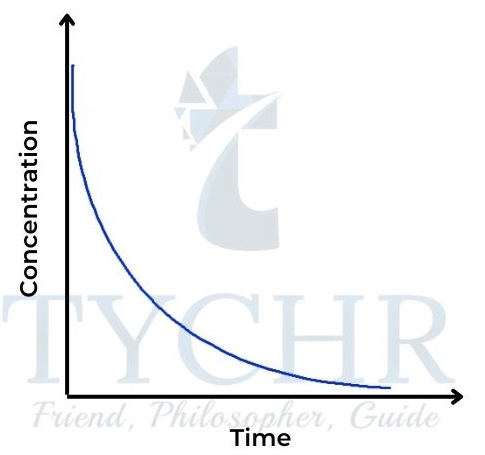
Figure 16: Concentration–time graph for a firstorder reaction.tration graph for a zeroorder reaction. 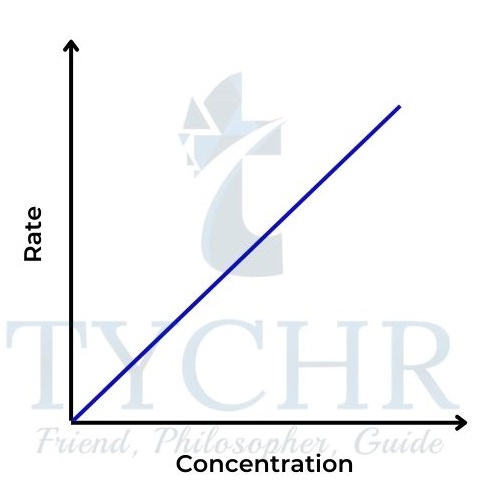
Figure 17: Rate–concentration graph for a first-order reaction.
Second-order reaction
- Here the rate is proportional to the square of the concentration of A. Rate = k [A]2.
- So the concentration–time graph is also a curve, steeper at the start than the fi rst-order graph and levelling off more (Figure 18). The rate–concentration graph is a parabola, characteristic of the square function (Figure 19). The gradient here is proportional to the concentration and is initially zero.
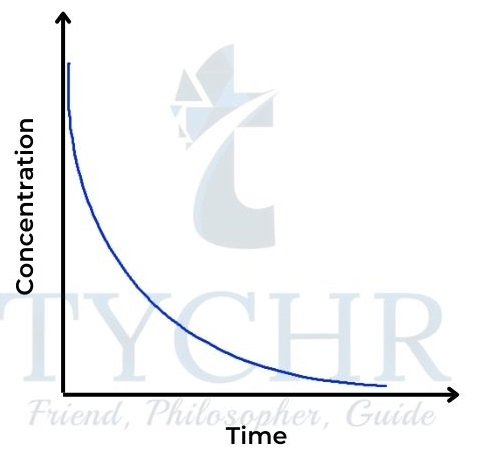
Figure 18: Concentration–time graph for a secondorder reaction 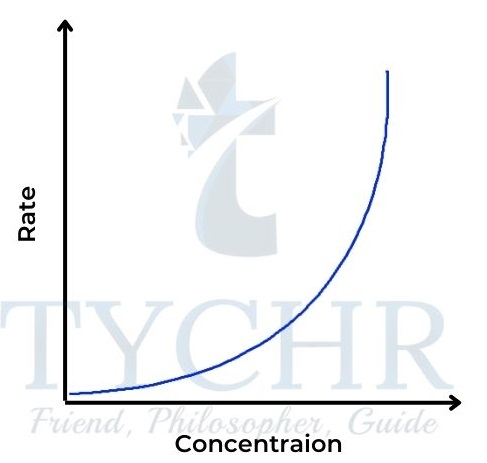
Figure 19: Rate–concentration graph for a secondorder reaction
Summary
- The relationships of concentration–time and rate–concentration graphs for zero-, first-, and second-order reactions are shown in Figures 20 and 21 for comparison.
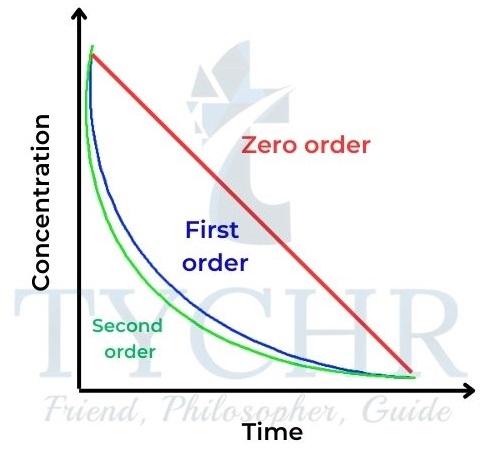
igure 20: Concentration–time graphs for zero-, first-
, and second-order reactions.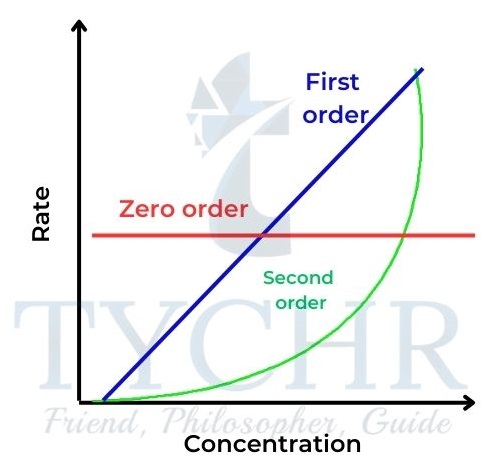
Figure 21: Rate–concentration graphs for zero-, first- , and second-order reactions.
Activation energy
Arrhenius equation
- For a chemical reaction to occur between two reactant particles, a number of conditions must be fulfilled:
- The two particles must collide with each other that is there must be physical contact.
- The colliding particles must have correct mutual orientation.
- The colliding particles must have sufficient kinetic energy to initiate the reaction itself.
- The reaction rate constant, therefore, can be expressed as follows:
k = p × Z × 𝒆−𝑬𝒂/𝑹T
- where: k = rate constant;
- p = steric factor (fraction of collisions where the particles have correct mutual orientation)
- Z = collision number (constant related to the frequency of collisions)
- e = the base of natural logarithms (2.718….)
- Ea = activation energy (in J mol-1)
- R = universal gas constant = 8.31 J K-1 mol-1
- T = temperature (in K).
- In this expression, 𝒆−𝑬𝒂/𝑹T represents the fraction of molecules that have sufficient energy for a reaction to take place and is termed the exponential factor.
- As p, the steric factor, and Z, the collision number, are both almost (not totally, however) independent of the temperature, the expression can be approximated to the following equation, called the Arrhenius equation:

- The Arrhenius equation can be rearranged by applying natural logarithms to give: