
Water, Aquatic, Food Production Systems and Societies
4.1 Introduction to Water Systems
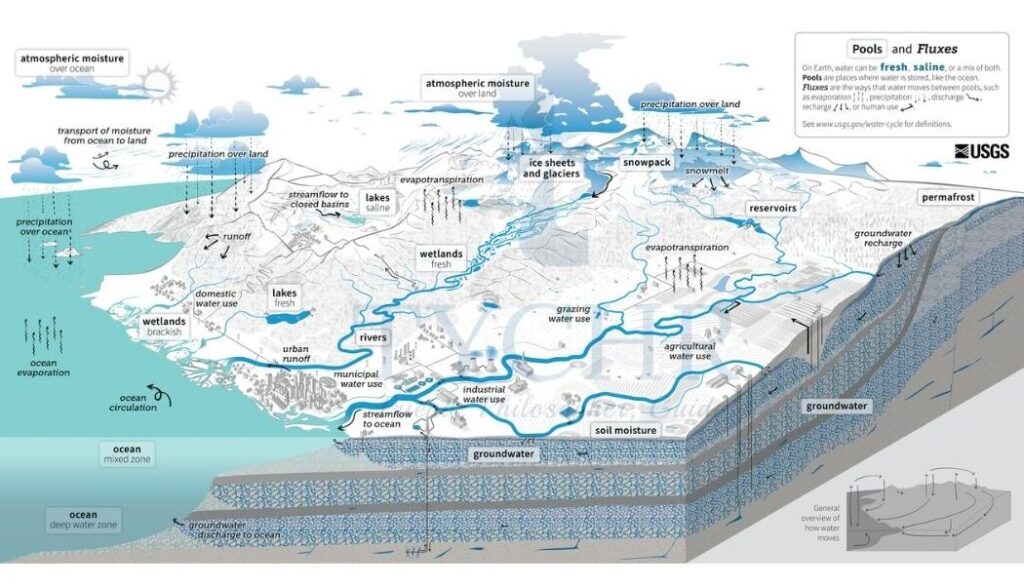
4.1.1 Hydrological Cycle
The hydrological cycle refers to the cycle of water between the biosphere, atmosphere, lithosphere, and hydrosphere. At a local scale—the drainage basin—the cycle has a single input (precipitation, and two big losses (outputs): evapotranspiration (EVT) and runoff. A third output (leakage) may also occur from the deeper subsurface to other basins.
Inputs | Outputs |
The main input into the drainage basin is precipitation. This includes all forms of rainfall, snow, frost, hail, and dew.
| Runoff: Refers to water flowing over the Earth’s surface. It increases with gradient, greater proportion of impermeable surface, reduced vegetation cover, during intense rainfall events and when the soil is saturated. |
4.1.2 Flows in the Hydrological Cycle
Infiltration
Infiltration is the process by which water soaks into or is absorbed by the soil.
Overland Flow
It is water that flows over the land’s surface. It occurs:
- When precipitation exceeds the infiltration rate.
- when all of the pore spaces in the soil are filled with water and it is saturated.
Base Flow
Base flow relates to the part of a river’s discharge that is provided by groundwater seeping into the bed of a river.
Storages in the Hydrological Cycle
- Vegetation- Refers to water that is caught and stored by vegetation.
- Soil- Soil moisture refers to the subsurface water in the soil.
- Aquifers- They are permeable rocks that contain significant amounts of water such as sandstone and limestone. Water moves slowly downwards from the soil into the bedrock – this is known as percolation. The upper layer of this is known as the water table. The water table varies seasonally.
- Cryosphere- The cryosphere is the snow and ice environment. Up to 66% of the world’s freshwater is in the form of snow and ice. Some of this may melt seasonally to produce major changes in the hydrological cycle.
- Channel Flow- Channel flow refers to the flow of water in channels such as rivers and streams. Most rivers will eventually transfer water to the ocean, although there are some that drain into inland lakes and seas.
4.1.3 Global Water Stores
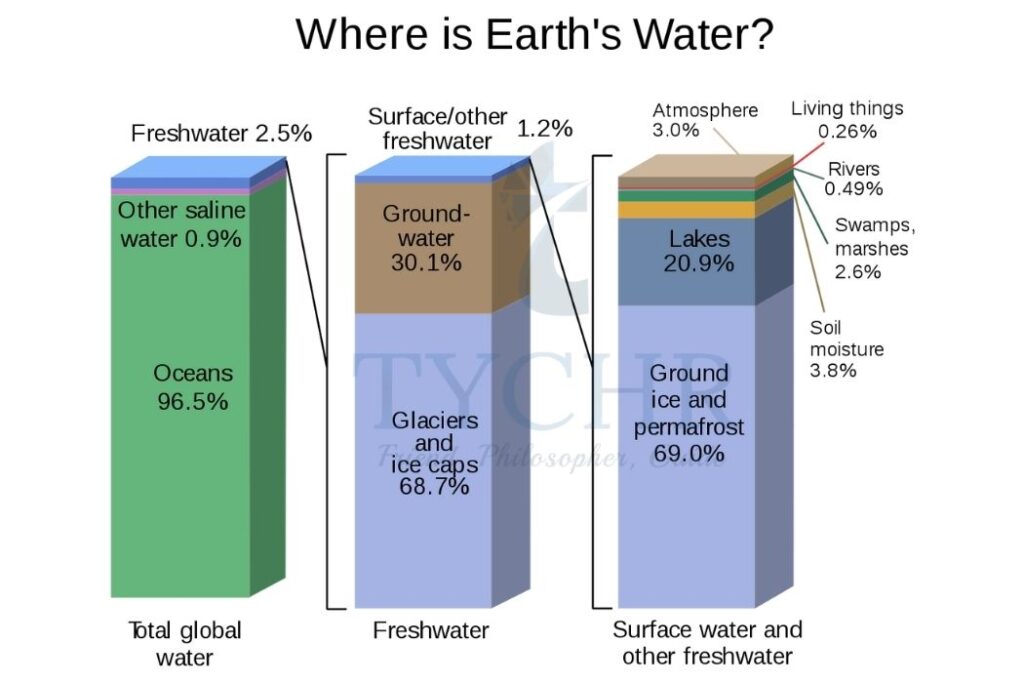
- The different forms of water in the Earth’s water budget are fully recycled during the hydrological cycle but at very different rates.
o The time for a water molecule to enter and leave a part of the system is called the turnover time. Turnover time varies enormously between different parts of the system. - The degree to which water can be seen as a renewable or non-renewable resource depends on where it is found in the hydrological cycle. Renewable water resources are waters that are recycled yearly or more frequently in the Earth’s water turnover processes. Thus, groundwater is a non-renewable source of water as turnover time is very long.
4.1.4 Human Influences on the Hydrological Cycle
Agriculture | Deforestation | Urbanization |
The decrease in infiltration and increase in overland flow and soil erosion are due to a number of factors:
|
| Building activity:
Encroachment on the river channel:
Replacement of vegetated soils with impermeable surfaces:
|
4.1.5 Ocean Circulation
Distribution of Oceans and Ocean Currents
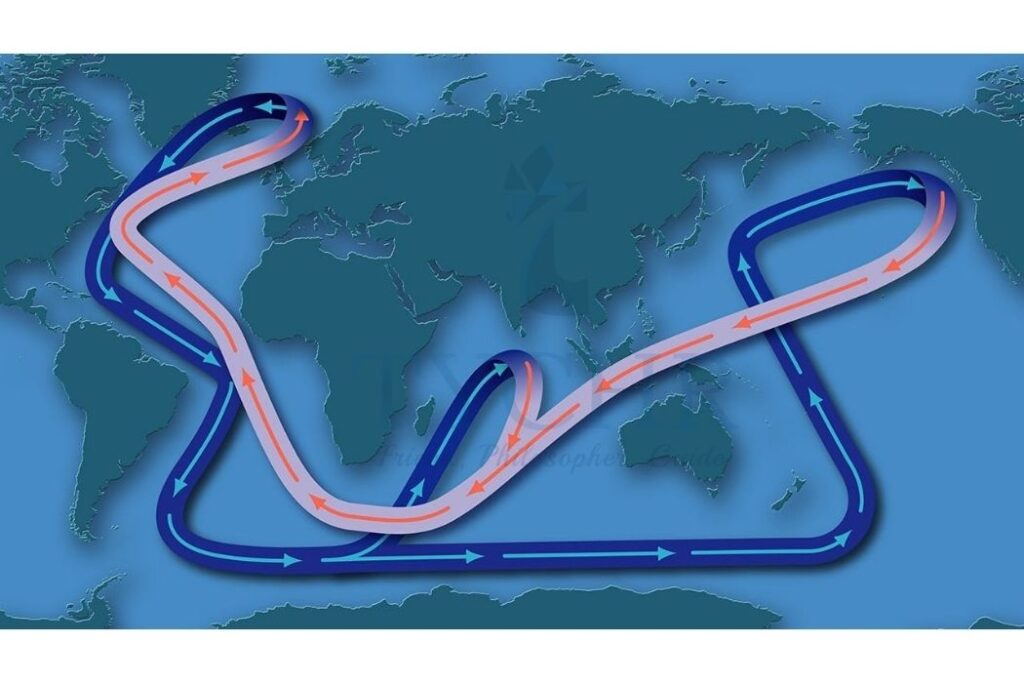
Oceans regulate climatic conditions through the atmosphere- ocean link. Warm ocean currents move water away from the equator towards the poles, whereas cold ocean currents move water away from the cold regions towards the equator. This deep, global-scale circulation of the ocean’s waters effectively transfers heat from the tropics to colder regions.
Salinity: Average salinity is about 35 parts per thousand (ppt). Concentrations of salt are higher in warm seas, because of the high evaporation rates of the water. The freezing and thawing of ice affects salinity. The thawing of large icebergs decreases salinity, while freezing of seawater increases the salinity temporarily. Salinity levels increase with depth.
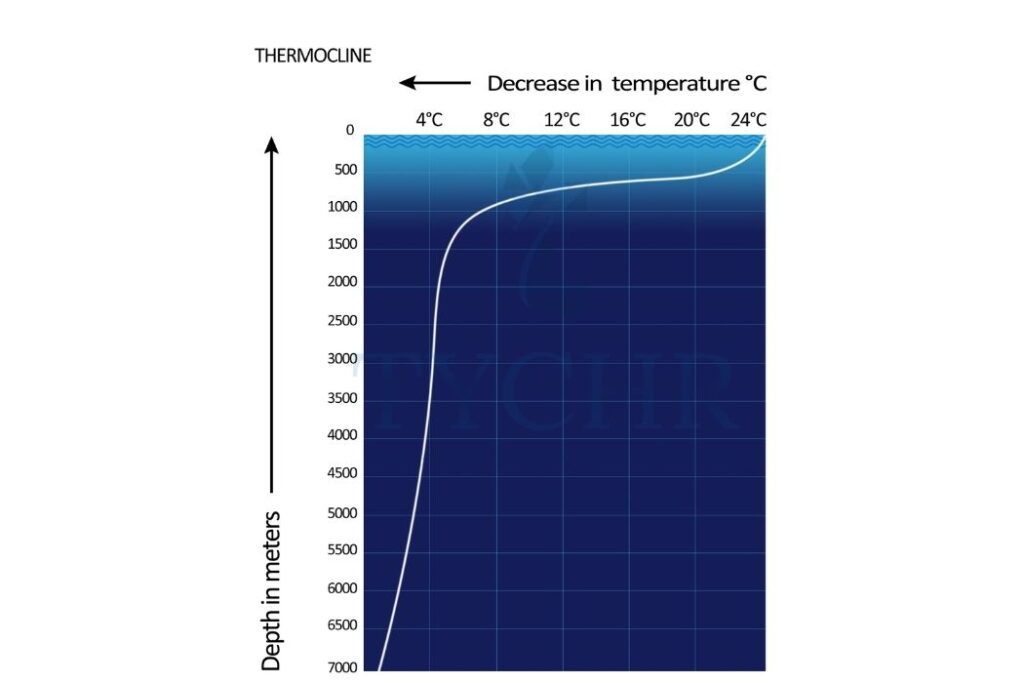
Temperature: Temperature varies considerably at the surface of the ocean, but there is little variation at depth.
Density: Temperature, salinity, and pressure affect the density of seawater. High temperature- Less density; high salinity, less density; high pressure, more density. When large water masses with different densities meet, the denser water mass slips under the less dense mass.
Specific Heat Capacity: Heat capacity is the amount of energy it takes to raise the temperature of a body. It takes more energy to heat up water than it does to heat land. However, it takes longer for water to lose heat.
The Importance of Ocean Circulation Systems: Surface ocean currents are caused by the influence of prevailing winds blowing steadily across the sea. The dominant pattern of surface ocean currents (known as gyres) is a roughly circular flow. The pattern of these the current is clockwise in the northern hemisphere and anticlockwise in the southern hemisphere.
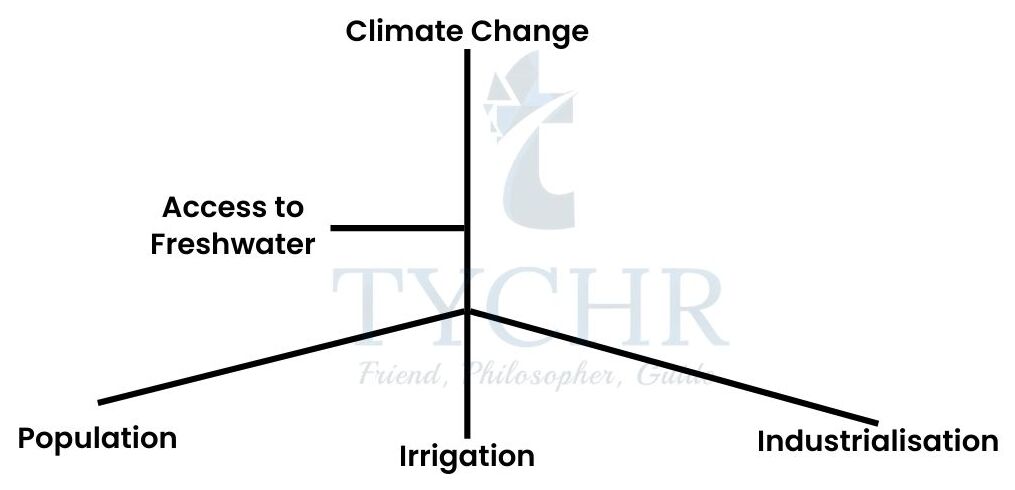
4.2 Access to Freshwater
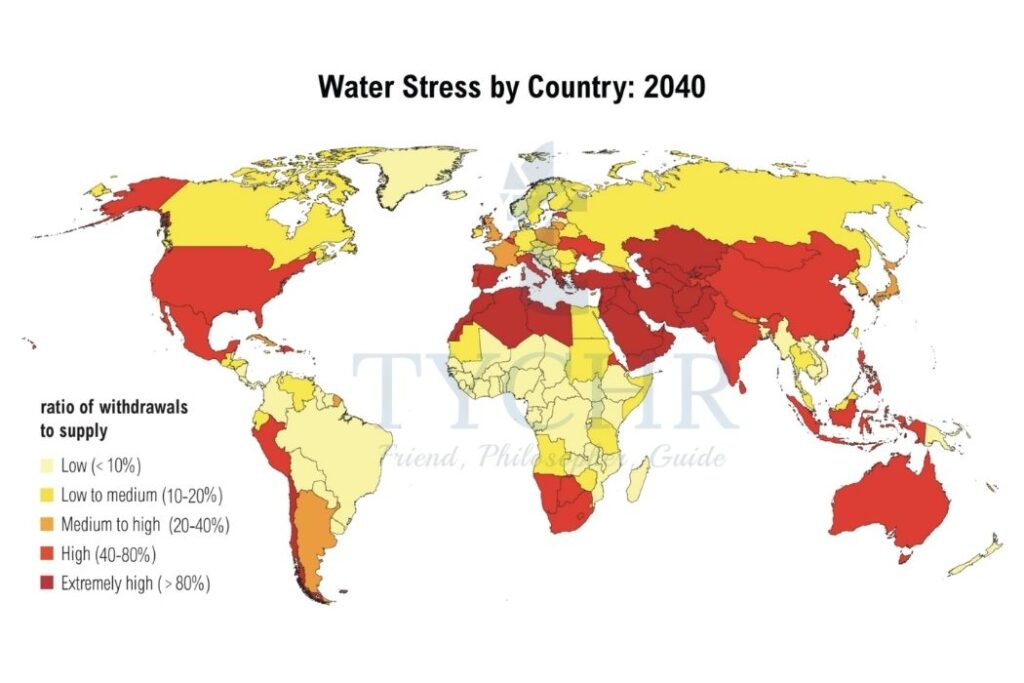
Given the scarcity of freshwater resources, the pressure put on them is great and likely to increase in the future in parts of the world. Without sustainable use it is likely that humans will face many problems. Already 2.6 billion people lack adequate sanitation.
Declining Freshwater Supply
The availability of fresh water is likely to become more stressed in the future. This may be the result of climate change, whereby rising temperatures lead to melting glaciers and increased evaporation. Unequal access to water may cause a conflict between those who have an abundance of water and those who do not.
4.2.1 Changes in Demand and Supply
Unsustainable Demands
More water will be required to produce food for the world’s growing population, partly because of changes in diet. Many industries- food, drinks, textiles, and pharmaceuticals industries, need large quantities of water for their products. Irrigation, industrialization, and population increase all demands on the supply of fresh water. Water supplies and rainfall patterns may be altered by global warming. Humans are supplied with fresh water by the hydrological cycle; however, we are draining water from underground aquifers and degrading it with waste at a rate that exceeds its capacity to be replenished.
Concept Link & Recap
- Redistribution is an example of a technocratic environmental value system. The use of engineering and capital to move water from one place to another.
- Water harvesting is an ecocentric environmental value system. It captures rainfall using simple techniques such as water butts to catch and store water.
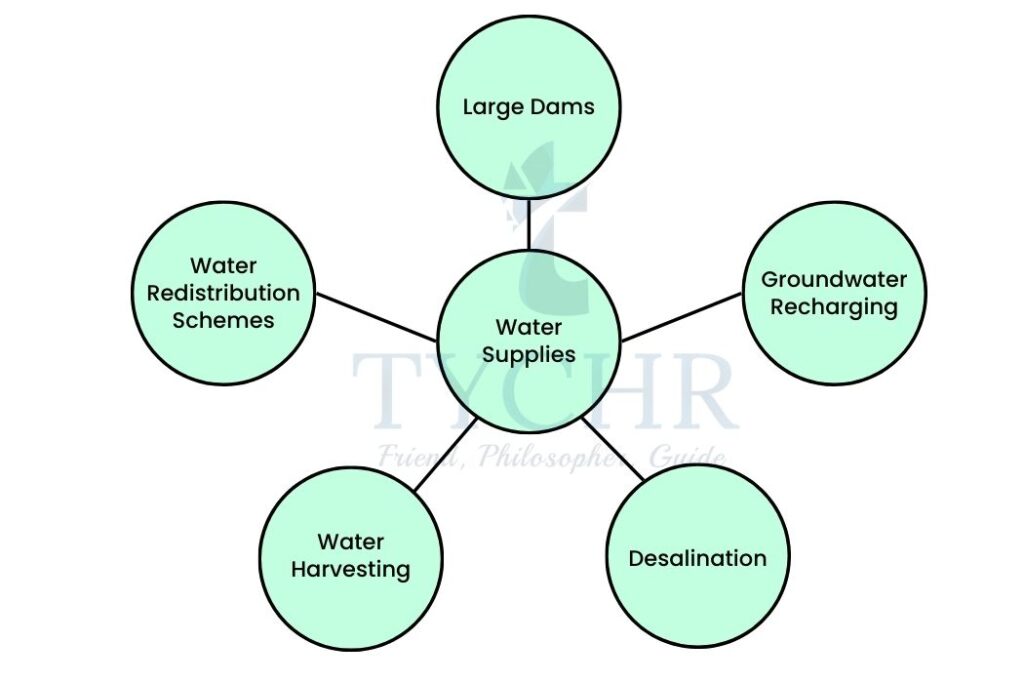
4.2.2 Enhancing Water Supplies
- Construction of Dams
Advantages of dams- include flood and drought control, irrigation, hydroelectric power, improved navigation, recreation and tourism. Disadvantages- water losses through evaporation, salinization,removal
of population, drowning of archaeological excavation sites, seismic stress, channel erosion etc. - Redistribution schemes
Redistributing water from wetter areas to drier areas. - Desalination
Desalination removes salt from seawater. This helps produce fresh water fit for human consumption (potable water) and for irrigation. - Water Harvesting Schemes
Refers to making use of available water before it drains away or is evaporated. Aims to capture and channel a greater share of rainfall into the soil, and conserve moisture in the root zone where crops can use it. - Groundwater Recharge
It occurs as a result of artificial recharge from irrigation and reservoirs. However, groundwater may be recharged naturally by infiltration of a part of total precipitation at the ground surface; through the banks and bed of surface water bodies. - Grey-Water Recycling
The wastewater that has been produced in homes and offices is known as gray water It may come from sinks, showers, baths and washing machines, but it does not contain faecal material.
4.2.3 Scarcity and Conflict
Many societies are now dependent primarily on groundwater, which is non-renewable. As societies develop, water needs increase. The increased demand for fresh water can lead to inequity of usage and political consequences.
At the point when water supplies come up short, populaces will be compelled to make extreme strides, like mass relocation. War and civil unrest may also result from a lack of water.
The Grand Ethiopian Renaissance Dam
Ethiopia is building Africa’s largest dam, on the Blue Nile. This opportunity for Ethiopia is a disaster for Egypt and is building tension in neighboring countries:
- This is no longer enough water to satisfy the growing population and agricultural sector.
- Annual water supply per person has fallen by well over half since 1970.
- The United Nations (UN) has warns of a crisis.
- The stakeholders- the governments of Egypt, Ethiopia and Sudan, as well as the people who will make use of the water.
- Egyptian leaders have been very forceful in the protection of their water supply. This has soured relations with the other countries that share the Nile Basin.
4.3 Aquatic Food Production Systems
4.3.1 Fisheries & Fish Stock
World Fisheries
- There has been a huge increase in the demand for aquatic food resources as the human population grows and diets change.
- World fisheries and aquaculture produced almost 150 million tonnes of fish in 2010. • The world’s fish food supply has grown dramatically since 1961.
4.3.2 Fish Stocks
Fish farming continues to grow faster than other major food production sectors.
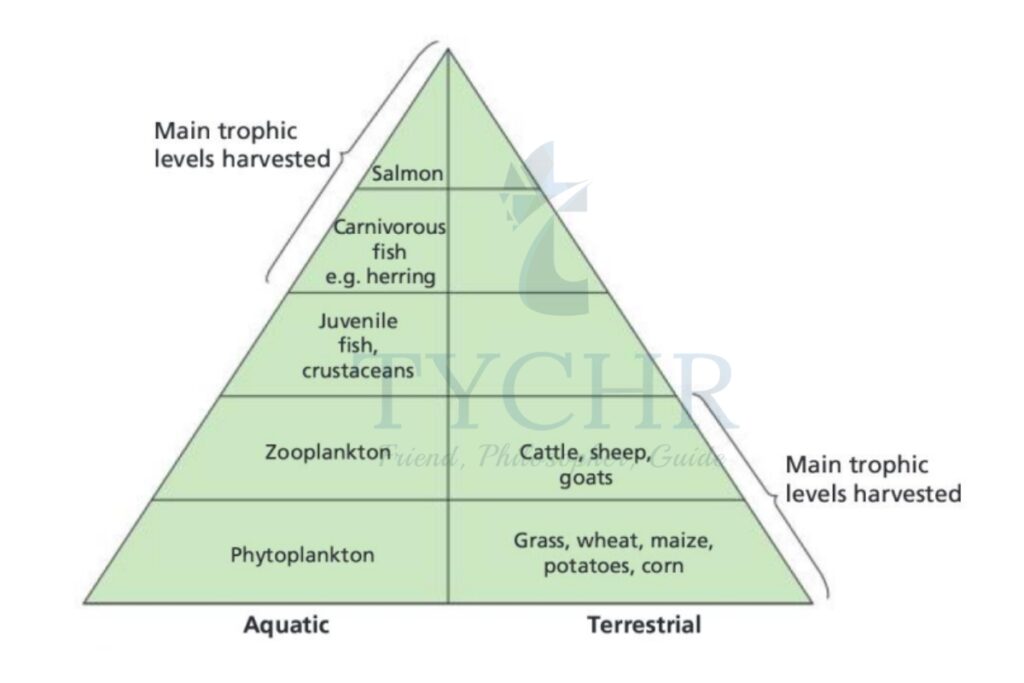
Terrestrial Systems
- Most food is harvested from relatively low trophic levels (producer and herbivores).
- Systems that produce crops are more energy efficient than those that produce livestock.
- This is because in the former, producers are at the start of the food chain and contain a greater proportion of the Sun’s energy than subsequent trophic levels.
Aquatic Systems
- The majority of food is extracted from higher trophic levels with much smaller total storages.
- This is less energy efficient than crop production (i.e. crops capture energy directly from the primary source; fish are several steps away from primary production).
Sustainable Yield
SY is the amount of increase per unit time (i.e. the rate of increase).
Where:
t = the time of the original natural capital
t + 1 = the time of the original capital plus yield,
SY = (total biomass at t + 1) – (total biomass at t)
OR
SY = (total energy at t + 1) – (total energy at t)
The relationship can be simplified as:
SY = (annual growth and recruitment) – (annual death and emigration)
4.3.3 Managing Fisheries
Fisheries can be managed in a number of ways:
- Total allowable catches (quotas for how much can be caught)
- Fishing licences can be issued
- Boat capacity management (only allow a certain number of boats/ size of boats) into an area
- Reducing environmental impact
- Specifying a minimum mesh size on nets
- Closing fishing grounds at different times of the year.
4.3.4 Aquaculture
Aquaculture has increased rapidly since the 1990s. Aquaculture involves raising fish commercially, usually for food.
Issues around Aquaculture | Environmental Effects |
|
|
4.3.5 Biorights
The harvesting of certain species, such as whales and seals, often raises ethical concerns over biorights, the rights of indigenous cultures and international conservation legislation. However, some indigenous communities are permitted to catch a small number of whales for subsistence use.
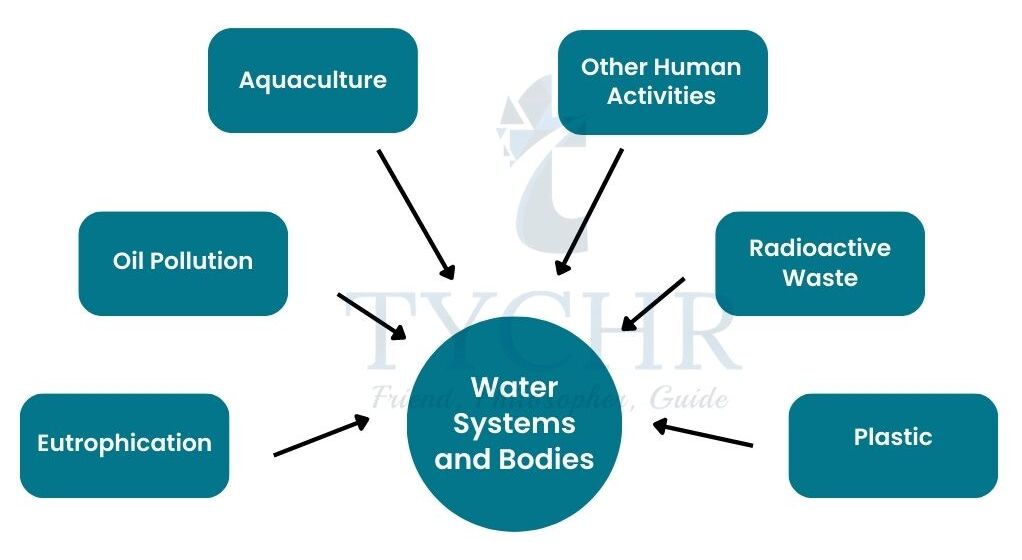
4.4 Water Pollution
Freshwater and marine pollution sources include run-off, sewage, industrial discharge, solid domestic waste, transport, recreation and tourism, and energy waste. Sources of marine pollution include rivers, pipelines, atmosphere, oil spills, deliberate and accidental discharges from ships, sewage from cruise ships, aquaculture farms, power stations, and industry.
4.4.1 Water Quality
The quality of aquatic systems can be directly evaluated using a wide range of parameters. These include temperature, pH, suspended solids, nitrates, metals, and phosphates.
4.4.2 Biochemical Oxygen Demand
Measuring Biochemical Oxygen Demand
BOD measures the amount of dissolved oxygen needed to break down organic material in water through biological activity. BOD is measured in the following way:
- Take a sample of water of measured volume.
- Measure the oxygen level.
- Place the sample in a dark place at 20°C in an airtight container for 5 days (lack of light prevents photosynthesis which would release oxygen and give an artificially low BOD).
- After 5 days, re-measure the oxygen level. 5. BOD is the difference be
4.4.3 Trent Biotic index
The decline of indicator species as organic pollution in a river rises is the basis for the Trent Biotic Index. This occurs because the species are unable to tolerate changes in their environment such as decreased oxygen levels or lower light levels. Those species best able to tolerate the existing conditions become abundant – which can lead to a change in diversity.
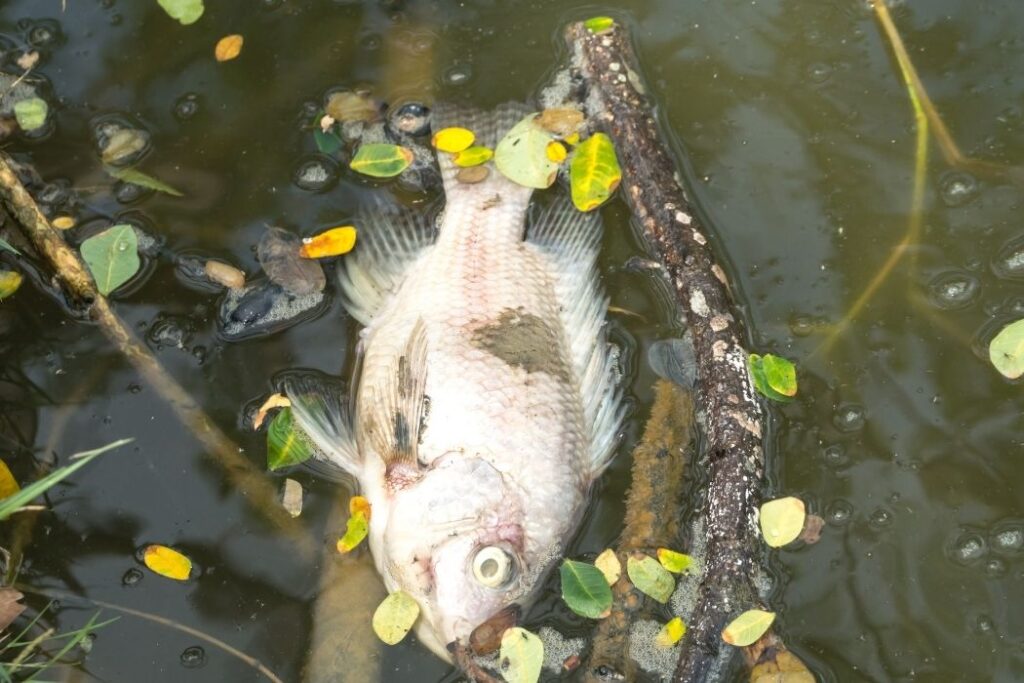
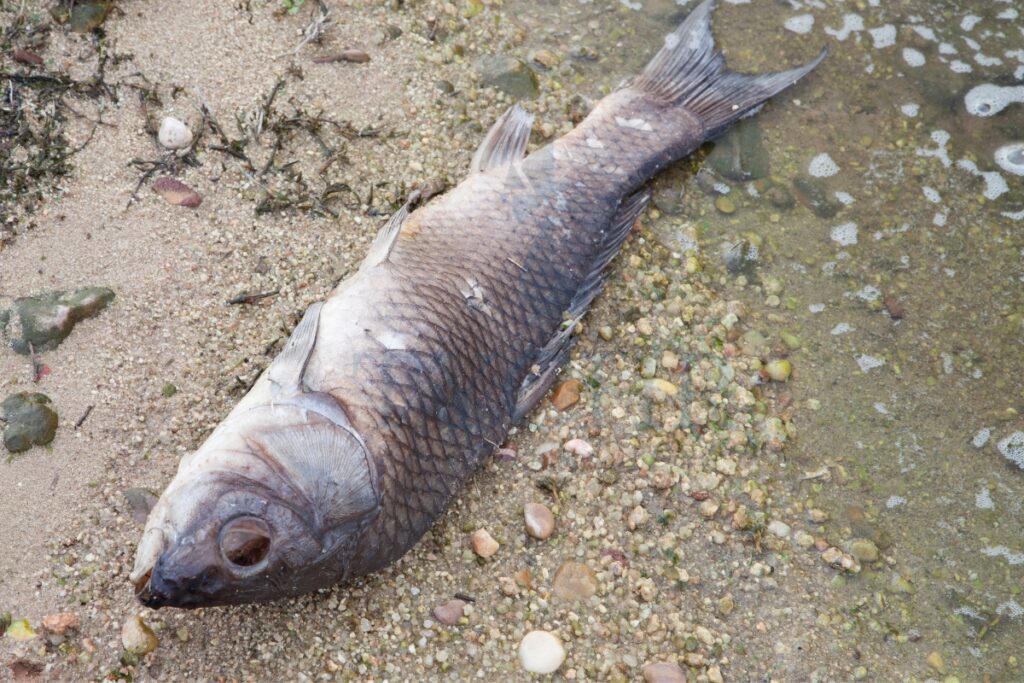
4.4.4 Eutrophication
Eutrophication refers to the nutrient enrichment of streams, ponds, and groundwater. It is caused when increased levels of nitrogen or phosphorus are carried into water bodies. It can cause algal blooms, oxygen starvation and, eventually, the decline of biodiversity in aquatic ecosystems.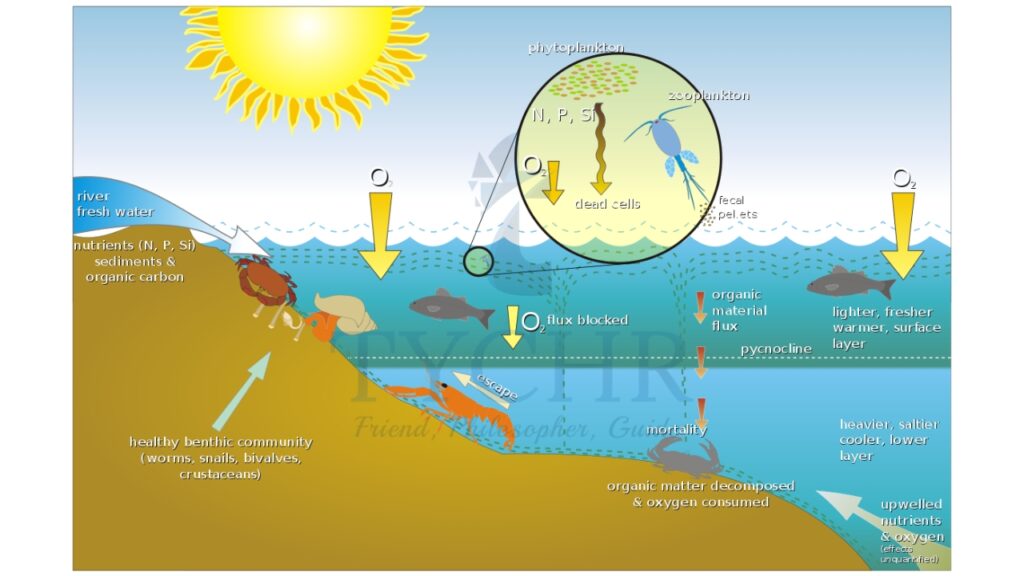
Did You Know?
Water pollution occurs when natural systems develop a new equilibrium and deviate from the long-term norm. This may result in a loss of biodiversity. Different environmental systems may suggest alternative strategies to manage the situation.
4.4.5 Management Strategies for Eutrophication
There are three main ways of combating eutrophication. These include:
- Using alternative fertiliser and detergent to alter human activities that contribute to pollution
- Regulating and reducing pollutants at the point of emission, for example in sewage treatment plants that remove nitrates and phosphates from waste
- Restoring water quality by pumping mud from eutrophic lakes.
4.4.6 Dead Zones and Red Tides
Dead Zones
Are hypoxic regions on the planet’s seas and enormous lakes, which makes these waterways neglect to help the marine life living there. These are areas that are teeming with simple, frequently harmful organisms.
Red Tides
Algal blooms, also known as red tides, are massive concentrations of aquatic microorganisms like protozoans and unicellular algae. They don’t always last long and don’t cover a lot of the sea’s surface, but they are getting bigger and more common: Over 400 locations have been identified as dead zones.
4.4.7 Impact of Waste on the Marine Environment
Oil Pollution | Radioactive Waste | Plastic |
|
|
|