
Economic Activity
Circular Flow of Income
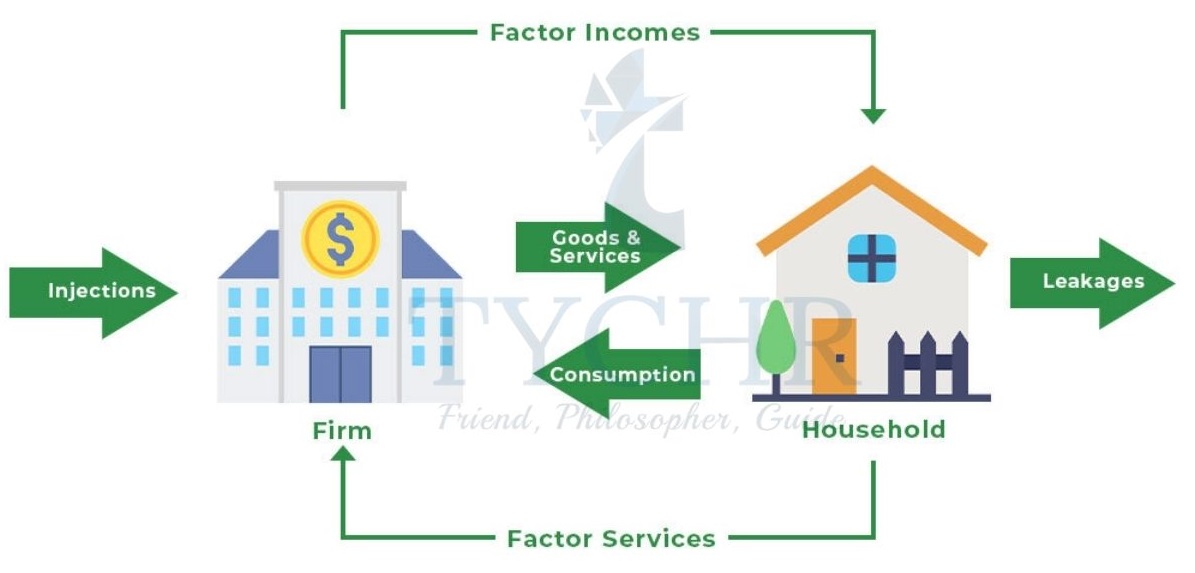
This model shows the concepts and relationships of an economy. The simplest one shows a closed economy where there is no government and has no international trade.
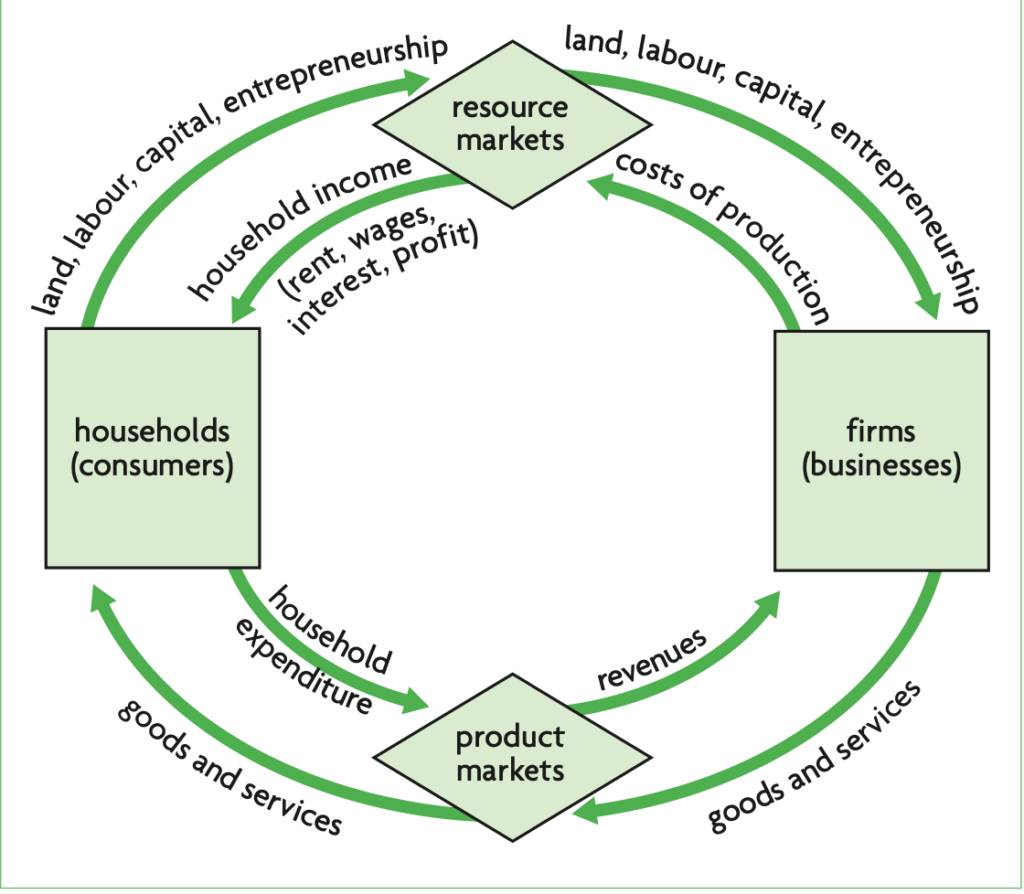
The above figure shows the flow of goods and resources from firms to households and the factors of production (land, labour, capital, entrepreneurship) from households to firms. The firms and the households are linked through 2 markets: Product market (sell goods and services) and resource markets (sell factors of production).
Note: The income flow(in the form of rent, wages, interest and profits from firms to households) is equal to the expenditure flow (amount spent by the consumer to buy goods or services from households to firms) in a given time period. The value of these flows is the same as the value of output flow, which is the value of all output produced by businesses.
Leakages and Injections
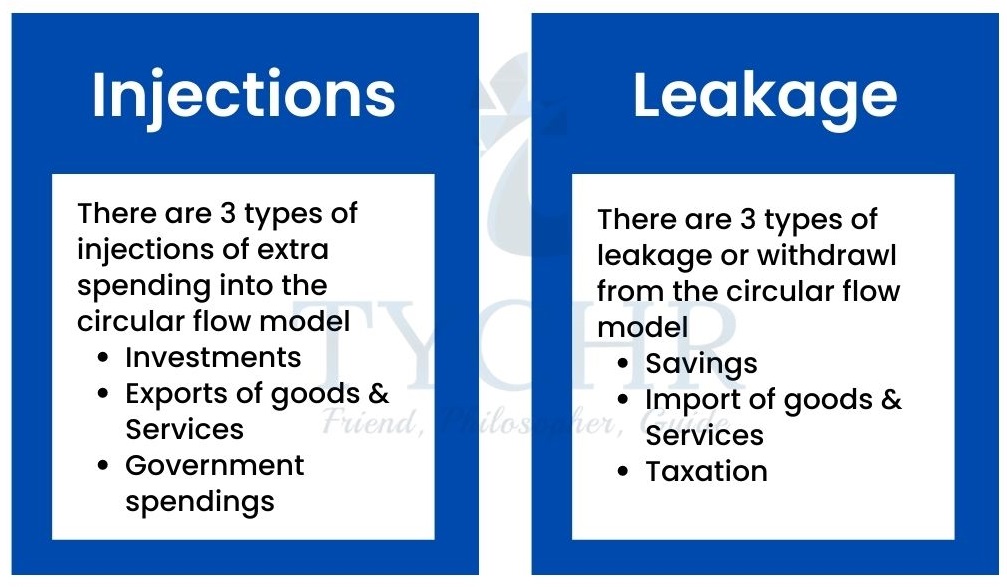
These two complicate the circular flow. They are often paired together
Savings – Part of the consumer income that is not spent.
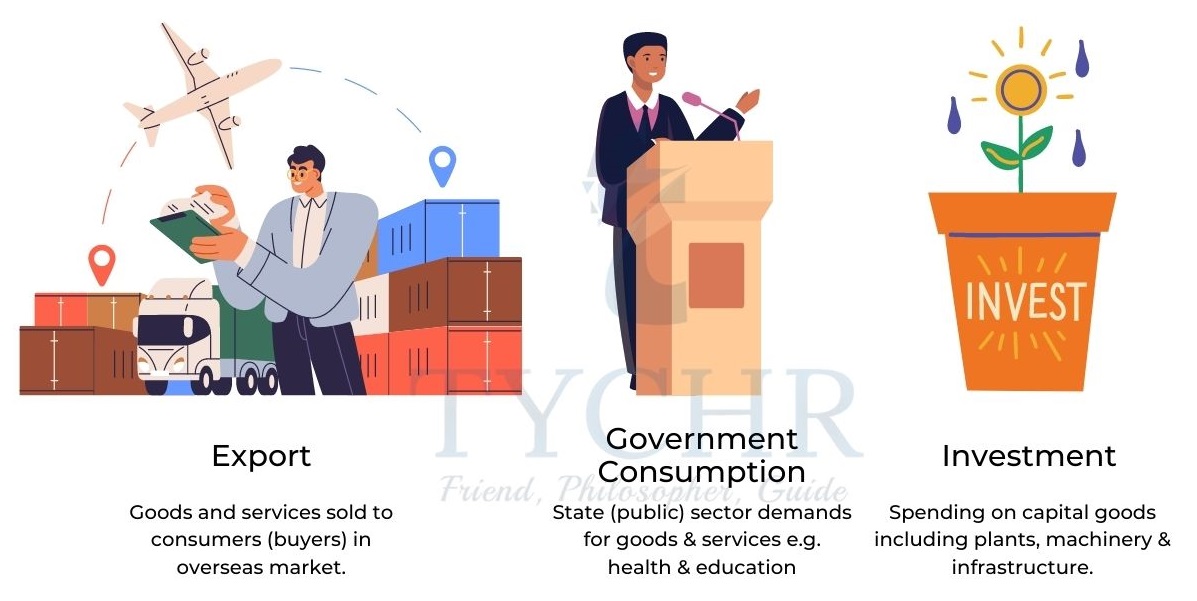
Investment – It is the spending by firms for capital goods production (machinery, etc)
When households pay taxes, there is a leakage because the taxes are not used to buy goods or services. When the government spends money on expenditure (education, sanitation, health, etc), there is an injection.
Imports – These are goods and services produced by other countries and purchased by domestic buyers.
Exports – These are goods and services produced domestically and bought by other countries. There is an open economy when there is international trade.
Note: Leakages are matched by injections. However, if injections are smaller than leakages, the income flow becomes smaller. If injections are bigger than the leakages, the income flow will increase in size.
Measures of Economic Activity
It involves measuring an economy’s national income (value of output). Output of an economy is called the aggregate output. This allows us to
- Assess economy’s performance
- Compare income/output performance
- Establish basis for making policies
- Quantities and values are used to measure output in macroeconomics..
Measurement of Economic Activity
Value of aggregate output = total income. National income is used synonymously with
aggregate output.
The Expenditure Method
combines all expenditures made to purchase finished goods and services produced within a nation. Only final goods, not intermediate (semi-finished) goods, are included.
Spending is categorized into :
Consumption (C) All purchases by households on final goods and services (but not housing).
Investments (I)
- Firms spending on capital goods like machinery, equipment, etc.
- Spending on construction (housing and buildings).
Government Spending (G) Spending by the government such as factors of production (labour services) and government investment (on roads, schools, public transport, etc)
Net Exports (X-M) Value of exports (X) minus value of imports (M)
Note: Gross Domestic Product (GDP) It is defined as the market value of all final goods and services produced in a country over a year (typically). It includes spending according to the four parts C, I, G, and (X-M).
GDP = C + I + G + (X-M)
The Income Approach
It adds up income earned by factors of production (wages, interest, rent and profit) within a country over a period of time. The national income isn’t the same as GDP and requires adjustment if GDP calculation is required.
The Output Approach
It calculates the total value of all of the goods and services produced by the economy over time. includes final goods and services to avoid counting them twice.
Different Measures of Vale of Output
Gross Domestic Product (GDP)Regardless of who owns the factors of production (value of final goods/services produced in a country), it is the market value of all final goods and services produced in a country over a period of time.
Gross National Income (GNI) Total income received by the residents of a country equal to the value of all final goods/services produced by the factors of production supplied by residents regardless of where the factors are located ( Value of goods and services made by people of a country).
Can’t reflect education, health and life expectancy.
Have no information about distribution of income and output.
Don’t take into account increased leisure.
Don’t account for quality of life which includes reduced crime rate, stress levels from working conditions’ etc.
Note: Because of the above, even real values can be misleading for comparisons over time and between countries.
Green GDP
GDP and GNI fail to account for the loss of environmental resources and include expenditure undertaken for the purpose of cleaning up pollution. Eg- If a country experiences an oil spill, the funds spent to clean up the pollutants is added to the value of national output.
Green GDP is the proposed method that would account for environment and environmental destruction.
Green GDP = GDP – value of environmental degradation
Another way is also to account for costs from cleaning up pollution (P).
Green GDP = GDP – value of environmental degradation – P
This would be more accurate, but also will be lower than GDP itself.
Calculations of GDP
Calculating GDP using expenditure method
GDP = C + I + G + (X-M)
Calculating GNP/GNI
GNI = GDP + net income from abroad
Note: Net income from abroad = Income from abroad – Income sent abroad.
Calculating real GDP using a price index (deflator)
Nominal GDP measures the value of current output valued at current prices, while real GDP measures the value of current output valued at constant (base year) prices. A price index is a measure of average prices in one period relative to average prices in a base year. A price index commonly used to convert nominal GDP to real GDP is a price deflator known as GDP deflator.
GDP deflator = Nominal GDP/Real GDP X 100 Real
GDP = Nominal GDP/Price Deflator X 100
The Business Cycle
A decrease in GDP is different from decrease in GDP growth.
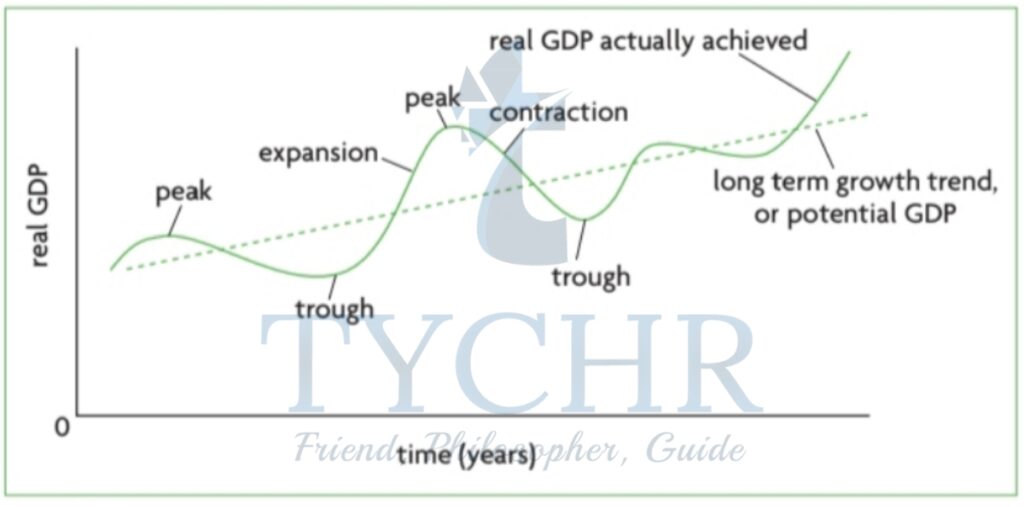
Fluctuations in the growth of real output, consisting of alternating periods of expansion
(increasing real output) and contraction (decreasing real output) are called Business Cycle or
Economic Fluctuation.
Each cycle consists of the following phases:
- Expansion : positive expansion of real GDP.Employment increases and the general
price level rises. - Peak :The peak of the cycle's real GDP, the end of the expansion, a significant drop
in unemployment, and a rapid rise in prices Inflation may occur. - Contraction: Real GDP begins to fall . If there is a contraction for more than two quarters, there is recession. Real GDP falls and unemployment increases. Price levels slow and may fall down.
- Trough : Cycle’s minimum real GDP, end of contraction. Widespread unemployment
followed by expansion (recovery).
The above points are sometimes called Economic Fluctuations because they are not predictable.
Trends
- Long term growth trend The straight line that shows how output grows when the fluctuations are removed. The output is known as potential output.
- Unemployment falls when real GDP grows (expansion).
- Firms hire more laborers and increase the quantity of output.
- Unemployment increases when real GDP falls (contraction).
- Firms cut production and have to lay off some workers.
- When an economy experiences full employment , there is still a natural rate of unemployment.
- If actual GDP > potential GDP, unemployment is lower than the natural rate.
- If potential GDP > actual GDP, unemployment is greater than the natural rate.
- There is a GDP (output) gap if the actual GDP is above/below the potential GDP.
Reasons to study the Business Cycle
Real output growth means that there’s a chance to have a higher standard of living.
Large fluctuations are not desirable, because with expansion, inflation could happen and with contraction, unemployment increases.
Some key macroeconomic objectives : rapid economic growth, full employment and price stability.