Elasticities Notes
The topic of Elasticities in IBDP Economics explores the responsiveness of demand and supply to changes in prices and income. Students will examine key types of elasticity, such as price elasticity of demand (PED), price elasticity of supply (PES), income elasticity of demand (YED), and cross-price elasticity of demand (XED). This topic is crucial for understanding how markets operate and how businesses and governments make pricing and policy decisions.
ELASTICITIES OF DEMAND AND SUPPLY
1.1 Meaning of Elasticity of Demand
Elasticity of demand is a measure of the degree of responsiveness of quantity demanded of a good to a change in its price or income or price of related goods.
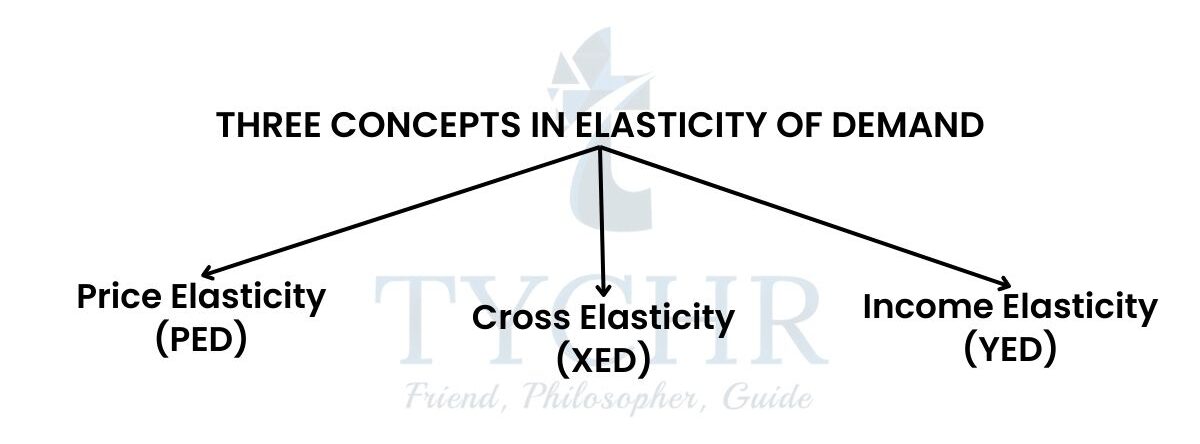
THREE CONCEPTS IN ELASTICITY OF DEMAND
 1.2 Price Elasticity of Demand, PED
PED is a measure of responsiveness of the quantity demand of a product to the change in its price.
Let the initial quantity demand of an item be represented by QD and its change be represented by ∆ QD. Let the initial price be represented by P and change in its price be represented by ∆ P. Hence, PED is measured by using the following formula, Let us try to understand this by following example- Suppose the price of a commodity falls from Rs.10 to Rs.6 and its quantity demand increases from 20 units to 30 units,
QD = Initial quantity demand = 20 units P = Initial price of commodity = Rs.10
∆ QD = Change in quantity demanded of the commodity = 30 – 20 = 10 units
∆ P = Change in price of the commodity = 6 – 10 = Rs.4
PED = ∆QD/∆P x P/QD
= (10/4) * (10/20)
= 1.25
Note: The sign of PED is considered positive ignoring the negative sign. This is done to avoid confusion. he use of percentages
Elasticity is measured in terms of percentages for two reasons:
To measure in common units.
To measure in absolute terms.
Degrees of Price Elasticity of Demand
PERFECTLY ELASTIC DEMAND (𝑃𝐸𝐷 = ∞):
When at a given price, the quantity demanded rises to any level, demand is said to be perfectly elastic. Items include Pizza, books, etc. (Refer Fig. E below)
PERFECTLY INELASTIC DEMAND (𝑃𝐸𝐷 = 0):
If change in price causes no change in quantity demanded, demand is said to be perfectly inelastic. Items include basic necessities such as salt. (Refer Fig. D below))
UNIT ELASTIC DEMAND (𝑃𝐸𝐷 = 1):
Demand is considered to be unit elastic if the percentage change in quantity demanded is the same as the percentage change in price. (Refer Fig. A below)
MORE ELASTIC DEMAND (𝑃𝐸𝐷 > 1):
If percent change in price is less than the percent change in quantity demanded, demand is said to be more elastic. (Refer Fig. B below)
LESS ELASTIC DEMAND (𝑃𝐸𝐷 < 1):
If percent change in price is more than the percent change in quantity demanded, demand is said to be less elastic. (Refer Fig. C below)

Variability of PED along a straight line demand curve
Relationship between PED and slope of demand curve
Note: PED varies through the range of curve whereas slope is constant for a linear demand curve.
- Factors Affecting Price Elasticity of Demand
FACTOR | ELASTIC DEMAND | INELASTIC DEMAND |
Nature of Commodity | Luxury | Necessities |
Substitutes | More | Less |
Proportion of Income | Spent is large | Spent is small |
Addiction | If addicted | If not addicted |
Time period | Long Run | Short Run |
Examples for the above
- Luxury- a/c and cars.
- Necessity- medicines, etc
- Time- If there’s an increase in the prices of cooking oil in short period, it’s difficult to switch to cooking gas, but in the long term it is possible.
- Income- If income is more, expenditures such as family vacations, luxury travel, etc can be availed.
The demand curve’s steepness and PED:
Steeper demand curves are relatively less elastic or inelastic whereas flatter demand curves are more elastic.
So to compare 2 demand curves which one is more elastic just draw both curves on a single diagram and find the intersecting point. To the left of the intersecting point steeper curve is less elastic.

Applications of Price Elasticity of Demand
PED and the effects of price-changes and total revenue:
Total revenue is in the amount of money received by firms when they sell goods or services.
TR = P x R
TR and PED can be explained with the help of following 3 possibilities
Demand is elastic (PED>1)
An increase in price means reduction in TR and vice-versa.
In the preceding graph, TR1 equals A+C in the event of a rise in price from P1 to P2, whereas TR2 equals A+B in the event of a decrease in price.
Demand is inelastic (PED<1)
An increase in price means an increase in total revenue(TR) A decrease in price results in decrease in TR.
In the above figure, due to increase in price TR1=A+C, and due to decrease in price TR2=A+B. TR1>TR2.
Demand is unit elastic(PED=1)
Change in price causes no change in total revenue. In the above fig, TR1(A+C) = TR2(A+B).
Total Revenue Test of Price Elasticity of Demand
IF | Fall in price | LEADS TO | Increase in Total Revenue | THEN DEMAND IS | ELASTIC |
Fall in price | Decrease in Total Revenue | INELASTIC | |||
Gain in price | Decrease in Total Revenue | ELASTIC | |||
Gain in price | Increase in Total Revenue | INELASTIC | |||
A change in price | No Change in Total Revenue | UNIT ELASTIC |
PED and firm pricing decisions
The pricing decisions are taken by the firm keeping the type of demand a product has(elastic, inelastic or unit elastic).
PED in relation to primary and manufactured products
Many primary commodities have a low PED(Price inelastic demand) because they are necessities and have no substitutes. Eg- medicines, agricultural products, etc.
Whereas, manufactured products have high price elastic demand because they have substitutes.
PED and indirect taxes
The lower the price elasticity of demand for the taxed goods, the greater the government. tax revenues and vice-versa.
1.3 Cross Elasticity of Demand, XED
XED is a measure of responsiveness of the quantity demand of a product to the change in price of related products or substitute products.
Let the initial quantity demanded of an item be represented by QD and its change be represented by ∆ QD. Let the initial price of a related/substitute good be represented by P and change in its price be represented by ∆ P.
Hence, XED is measured by using the formula,
Note: The sign of XED can be positive or negative. Sign is not ignored.
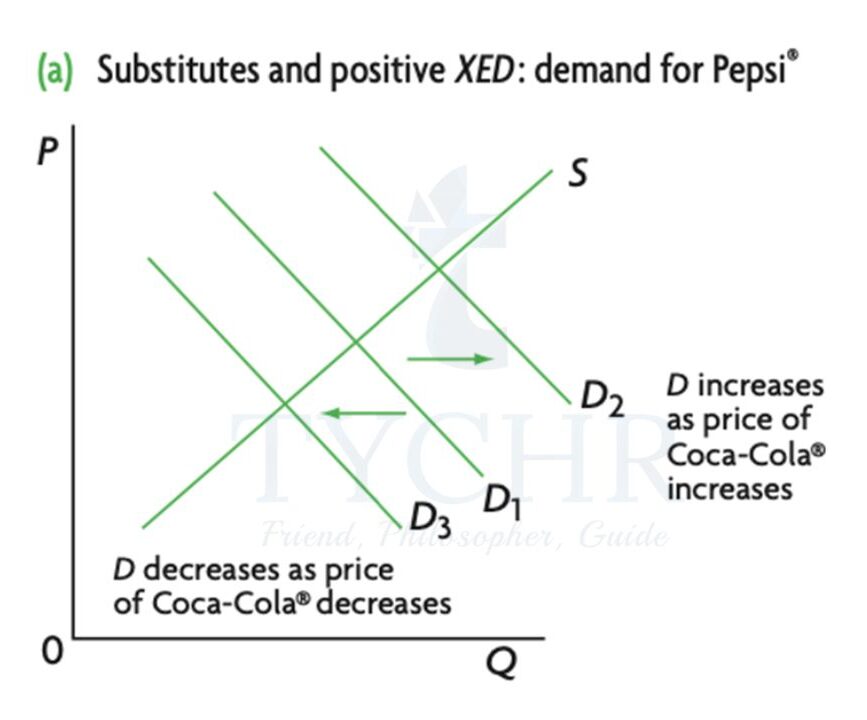
Positive XED: Substitute Goods
Incase of substitute goods, demand for one good and price of another good change in the same direction.
Eg- Coke and pepsi.

Note: In substitute goods Larger XED= Greater substitutability between 2 goods= Larger shift in demand curve due to price change.
Eg- A good having XED=+0.7 is a stronger substitute than a good having XED=+0.3 .
Negative XED: Complementary Goods
Incase of complementary goods, the demand for one good and the price of the other good change in opposite directions.
In the above figure, when the price of a tennis racket decreases, the demand for tennis balls increases (Demand shifts from D1 to D2) and vice versa.
Note: In complementary goods, Larger the –ve value of XED, Greater the complementarity between 2 goods, larger the shift in demand curve.
Eg- Goods having XED -0.8 are stronger complements than goods having XED – 0.5.
Zero XED: Unrelated Goods
If XED is zero, then the two goods are unrelated, XED is zero. Eg- Umbrella and onions.
Application of cross price elasticity of demand
Incase of substitute goods:
Goods of a single business:
Let’s take an example of coke and sprite.It’s important for the business to consider XED while making pricing decisions. Eg- Coke Price Sprite Demand.
Whether the coke price should be cut or not is based on 2 main points
PED of coke to know whether in coke prices will or Total revenue.
Degree of XED for coke and sprite: If XED is positive but low substitutability, then percentage reduction of coke prices will lead to small percentage change in sprite demand and vice-versa.
Goods of rival businesses
Eg- Coke and pepsi. A large XED between coke and pepsi means a fall in the price of coke will lead to a large fall in demand for pepsi.
Incase of Complementary Goods
XED for complementary goods is also helpful in pricing decisions. Eg- A product with high negative XED means reducing the price of one good will lead to large increase in demand of the other good.
1.4 Income Elasticity of Demand, YED
Eg- sports clothings and sports equipment.
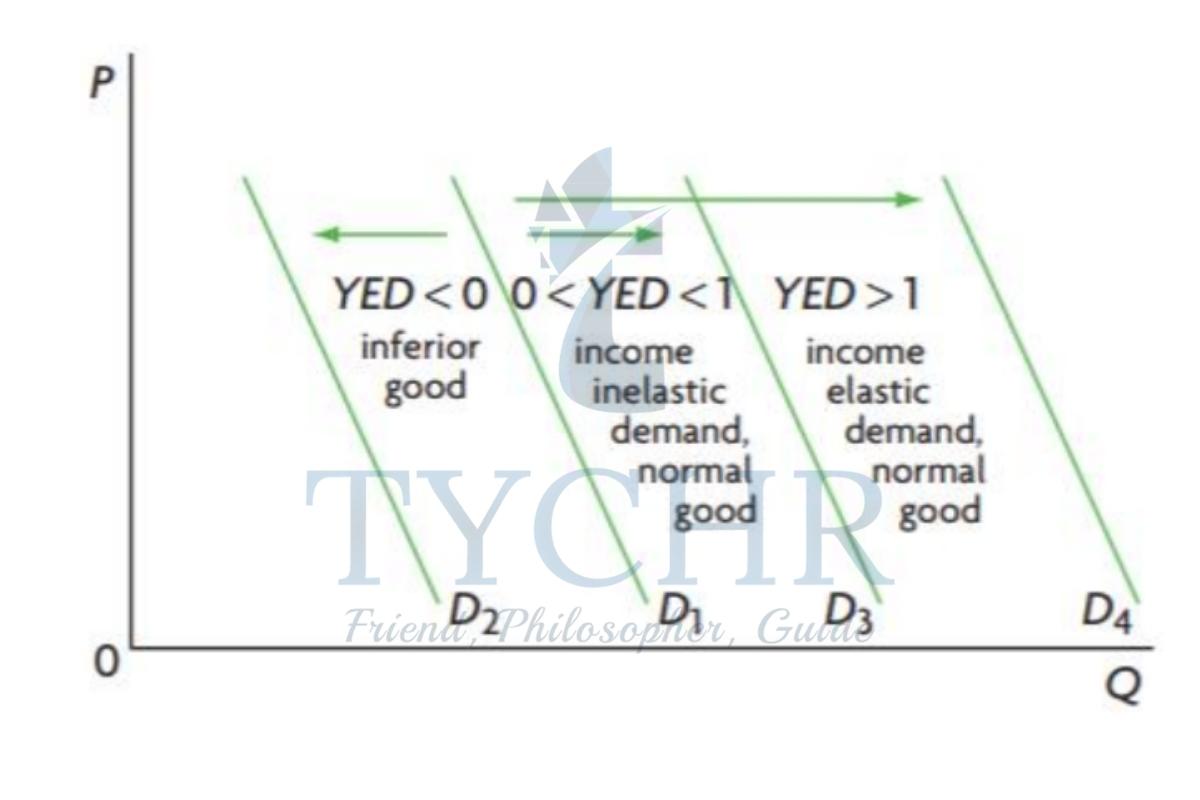
YED is a measure of the responsiveness of demand to changes in income, and involves demand curve shifts. It provides information on the direction of change due to change in income and on the size of the change.
Note: When YED>0 (positive), it is a normal good. Eg- new car, new clothes. When YED<0
Let the initial quantity demanded by the consumer be represented by QD and its change be represented by ∆ QD. Let the initial income of that consumer be represented by Y and change in its price be represented by ∆ Y.
Hence, YED is measured by using the formula,
𝑌𝐸𝐷 =% Change in Quantity demanded
=% Change in Income
QD Y
= 𝑥
∆Y QD
Hence, it can be said that YED will be positive for normal products like branded items where an increased income leads to higher demand for that product in the market. However, for inferior/cheap products like local brands, the same is exactly opposite and YED shall be negative, where an increased income leads to lesser demand of that product in the market.
Interpretation of YED Coefficient:
- Elastic: If a product’s quantity demand changes significantly with a percent change in income. Eg: a need for hybrid vehicles
- Inelastic: if a small percentage change in a product’s quantity demand will result from a change in income. Eg: popularity of fast food
- Unit Elastic: If percent change in income is same as percent change in quantity demand of a product. Eg: demand for normal goods

Application of YED
- YED and rate of expansion of industries.
Higher the YED for a good, the greater the marked expansion in future. - On the contrary when recession is there YED>1 will experience fall in sales, YED<0 will experience increase in sales.
- YED and the economy.
Elasticity of supply is the degree of responsiveness of supply of a commodity due to change in its price.
It is measured by using the formula, Es = % Change in Quantity supplied of a product/% Change in Its Price
2.1) Type of Price Elasticity of Supply
Elasticity Coefficient | Type of Elasticity | Relationship between Price & Supply |
Es = 0 | Perfectly Inelastic | No change in Supply |
Es < 1 | Less than Unitary Elastic | Change in Supply < Change in Price |
Es = 1 | Unitary Elastic | Change in Supply = Change in Price |
Es > 1 | More than Unitary Elastic | Change in Supply > Change in Price |
Es = ∞ | Perfectly Elastic | Extremely large change in Supply with no change in Price |
Determinants of PES
Length of Time Short Period
| Short period | Long period |
Quantity of stock | Firms with high stock | Firms with low stock |
Mobility of factors of production | Immobile resource | High mobility resources |
CAPACITY OF FIRMS SPARE(UNUSED) | Greater spares capacity | Lesser spares capacity |
2.2) Factors Affecting Elasticity of Supply
- Nature of Commodity
- Time Period
- Nature of Inputs used
- Technique of Production
2.3) Importance of Elasticity of Supply
Determination of Rent:
When perfectly inelastic, entire earnings of the factor would be rent.
Determination of Price:
It helps in determining the price of a commodity.
In conclusion, mastering the concept of Elasticities in IB DP Economics is essential for analyzing how different factors influence market dynamics. Understanding elasticity helps students predict the effects of price changes on both consumers and producers. For further support and expert guidance, students can turn to Tychr, where experienced IB Economics HL & SL tutors provide personalized assistance to help students excel in this important economic concept.

