macroeconomic objectives i low unemployment, low and stable rate of inflation Notes
Low Unemployment
- Unemployment – people of working age who are actively looking for a job but are not employed.
- Underemployment – people of working age with part-time jobs when they would rather work full time.
- Inefficient allocation of resources – The economy is wasting resources by not using them fully.
MEASURING UNEMPLOYMENT
- Labor Force – number of employed people + number of unemployed people of working age
Excludes: children, retired, people who can’t work, and people who don’t want to work. - Unemployment rate = (number of unemployed)/(Labor Force) x 100
- An accurate rate is hard to get because of hidden unemployment.
- Unemployment figures:
- Include unemployed people actively looking for work. It excludes discouraged workers (unemployed workers who have given up job-searching).
- Don’t distinguish between full-time and part-time employment and count part- time workers as full-time.
- Doesn’t distinguish one type of work.
- Don’t include people on retraining programs or those who retire early.
- Don’t include people working in the underground/informal economy.
- The national unemployment does not account for differences that arise due to population groups
Region, gender, ethnic groups, age, occupation/skill.
CONSEQUENCES OF UNEMPLOYMENT
- Loss of real output – output produced is less than what the economy is capable of producing
- Loss of Income for unemployed workers – workers worse off financially
- Loss of tax revenue – unemployed people have no Income, so they don’t pay income taxes
- Costs to the gov’t – less tax revenue for other goods/services and social problems will cost tax revenue
- Unequal distribution of Income – unemployed become poorer and employed maintain income.
- Having trouble finding work because jobs that require new skills (hysteresis) can be hard to find.
- Personal problems – unemployed will be stressed and will result in problems
Greater social problem – high rates of unemployment can cause serious social problems
TYPES OF UNEMPLOYMENT
Structural unemployment
- Demand changes, location changes, and labor market rigidities
- Changes cause demand for new skills, leads to mismatch between supplied/demanded skills
- Firms relocate to foreign countries, because the production costs may be cheaper there
- Labor market rigidities – factors preventing supply and demand forces from working in labor market: minimum wage, labor union/wage bargaining, employment protection laws, unemployment benefits
Frictional unemployment
- Workers between jobs; fired, quit, or wanting a better job
- certain amount of frictional unemployment inevitable, due to incomplete information
Seasonal unemployment
- Demand for labor changes due to seasonal changes
The 3 types of unemployment above are considered inevitable & make up natural unemployment.
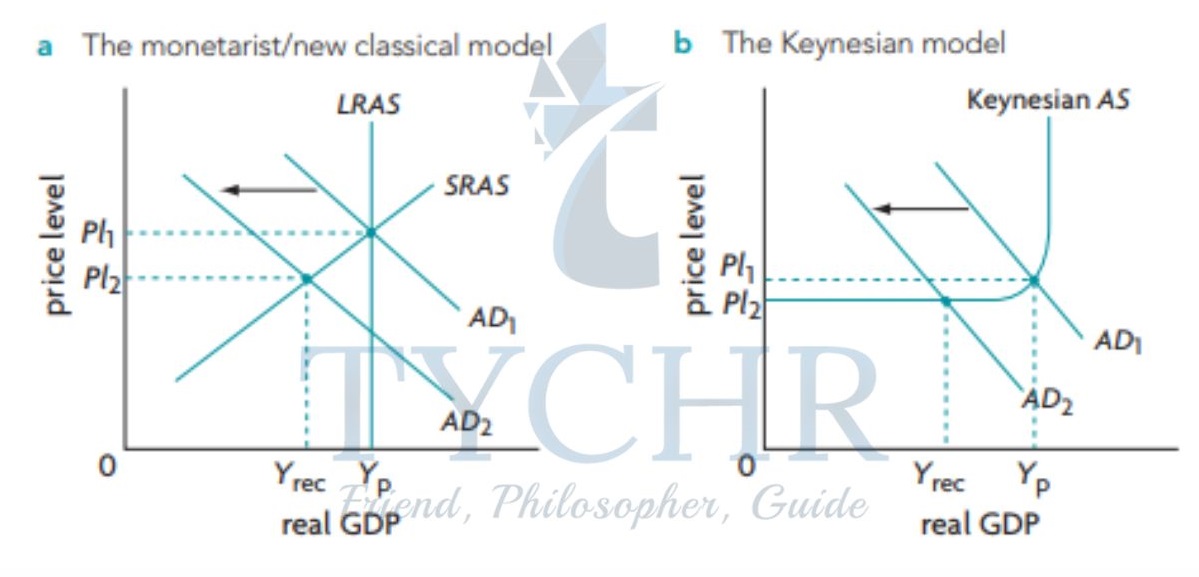
Cyclical unemployment (demand-deficient)
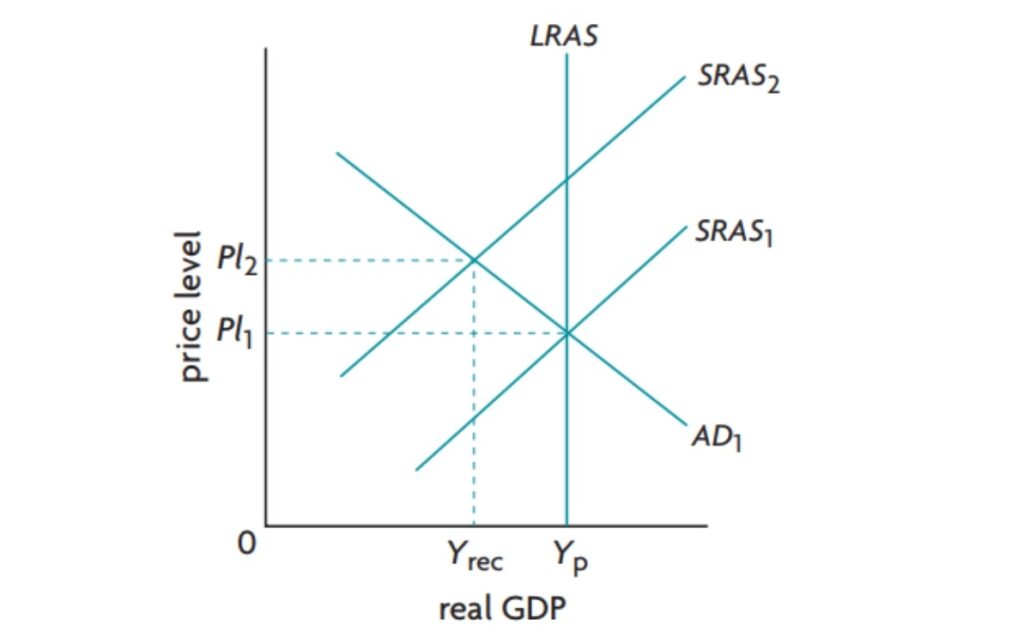
- Unemployment that arises when the economy produce less than its potential output
- Occurs during downturns of business cycle (recessionary gap); decrease in AD.
- Real GDP declines as AD decreases, and businesses lay off workers.
- Keynesian concept representable in both models
- Usually involve government policies to close the recessionary gap by increasing AD.
- Potential output (Yp): unemployment = natural rate. Cyclical unemployment = O.
- Recessionary gap (less than Yp): unemployment > natural rate. Cyclical unemployment present.
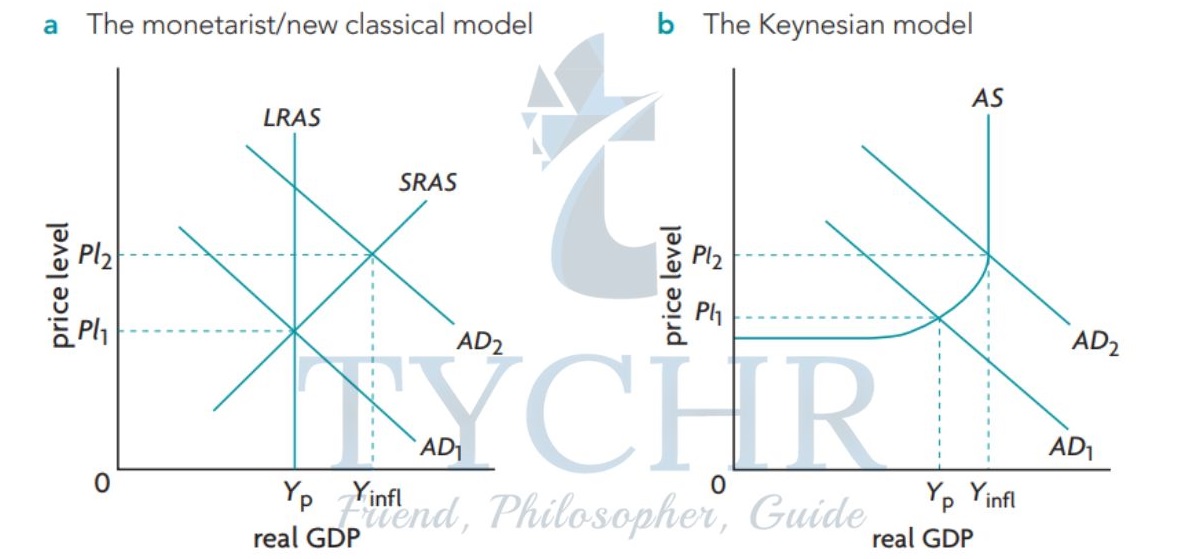
- Inflationary gap (more than Yp): unemployment < natural rate. Cyclical unemployment = O.
- Different parts of unemployment require different types of government policies.
Stable and low inflation rates
Inflation – sustained increase in general price level
Deflation – sustained decrease in general price level
Disinflation is when inflation slows down.
MEASURING INFLATION AND DEFLATION
- Price Indices are used to measure inflation or deflation. It’s the measure of average price in a base period.
- Consumer Price Index (CPI) – measure of cost of living of a typical household. A hypothetical basket with lots of goods is created and the value is cost. The same basket has its value calculated for later years. The percentage change shows whether there is Inflation/deflation.
PROBLEMS WITH CPI
- Different inflation rates for different income earners based on consumption patterns
- Different inflation rates depending on cultural/regional factors
- Consumption changes when prices change (substitutes)
- Consumption changes due to new products
- Consumption changes due to discount stores
- Product quality change
- International comparisons
- Comparability over time (less over longer periods of time)
- Some goods have high volatility prices because of wide supply/ demand swings. This can cause problems if they are included in the CPI.
- Economists measure a core rate of Inflation, which is usually a CPI without volatile food/ energy items
PRODUCER PRICE INDEX (PPI)
- PPI is several price indices of prices received by producers at different stages.
- Measure price level changes from producer point of view.
- Can be seen as a predictor for CPI change
- % change in real income (purchasing power) = % change in nominal income – rate of inflation
If the price level increases, your nominal income increases, but your real (purchasing power) income remains the same.
CONSEQUENCES OF INFLATION
- Redistribution effects – inflation redistributes income, some people become well and others worse off.
- People with fixed or slow increasing income/ wages become worse off because of the price level changes.
- Cash holders are worse off because the purchasing power decreases.
- Savers of money become worse off because they need to have an interest rate equal to inflation rate.
- Lenders may be worse off.
- Borrowers gain because the money borrowed is probably worse off.
- Payers of fixed or slow increasing Incomes have to pay less.
- Uncertainty – People can’t really predict the future and have to be more cautious.
- Menu costs – firms have to adjust prices and reprint menus and advertisements and they cost.
- Money illusion – people feel better off when their nominal income increases even though they don’t really have extra real income.
- International competitiveness – Exports become more expensive if the price level of that country increases and thus there will be more imports than exports.
- Governments prefer a low and stable rate of inflation, not zero rates, because a zero rate is really close to deflation. Ideal rate – 2-3%.
HYPERINFLATION
- Very high rates of inflation – price levels increased by more than 50% per month.
- Money loses its value very fast and it has an adverse effect on economic activity. Businesses stop investing in productive activities.
TYPES/ CAUSES OF INFLATION
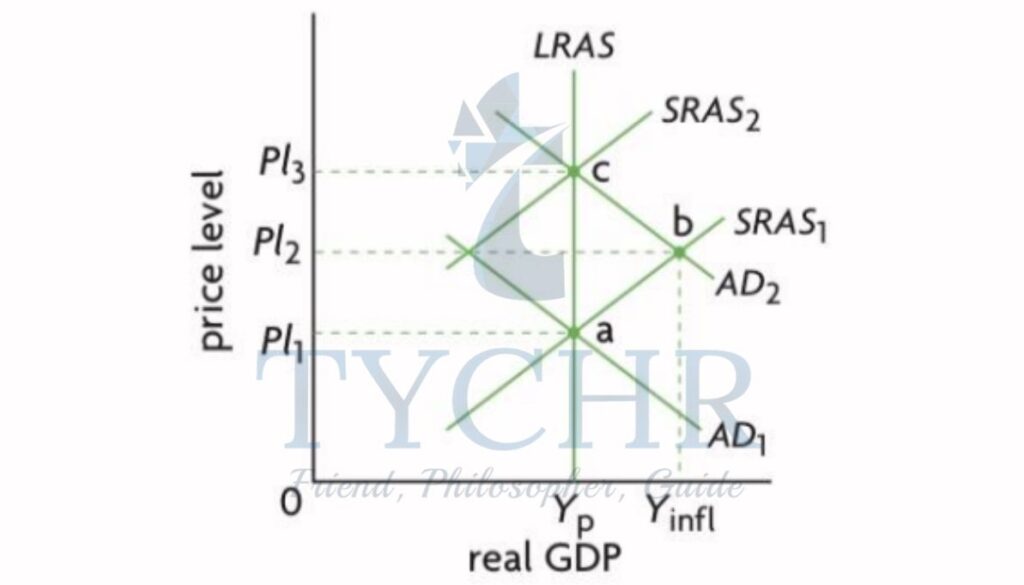
- Demand-pull inflation – inflation caused by increases in AD, which is called by changes in the AD determinants. Involves excess of AD over AS at full employment – and there would be an increase in AD.
- Cost-push inflation – inflation caused by production cost increases or supply-side shocks.
- Only analyzed in monetarist model and not in the Keynesian model
- Not a recessionary gap because the SRAS curve, not the AD curve moves.
- SRAS decrease can cause stagflation.
Worldwide, deflation is less common.
- Wages don’t fall easily
- Price wars may occur
- Menu costs caused by price changes should not be incurred by businesses.
CONSEQUENCES OF DEFLATION
- Redistribution effects with effects opposite of inflation
- Uncertainty, menu costs
- Risk of deflationary spiral – deflationary spiral is a series of events that make the deflation worse and consumers spend less because they expect the price to fall
- Risk of bankruptcies and crisis – real value of debt increases during a deflation and thus makes it harder for firms or consumers to pay back the debt.
CAUSES OF DEFLATION
- Usually a decrease in AD leads to a “bad” deflation and an increase in AS leads to a “good” deflation.
- Bad because it is associated with recession.
Good deflation associated with expansion (LRAS shift to right). - Deflation still isn’t good because it discourages spending, and is sometimes a greater threat than inflation.
- Bad because it is associated with recession.
Topics on Inflation (Higher Level Topics)
WEIGHTED PRICE INDEX AND RATE OF INFLATION
Weighted price index is a price index that weighs the various goods and services according to their relative importance in consumer spending.
To construct a weighted price index,
- Find value of the basket in current prices for each year.
- Use the above formula.
COMPARISON BETWEEN CPI AND GDP DEFLATOR
There are two reasons why CPI is preferred:
- The GDP Deflator includes irrelevant goods and excludes imports.
- In GDP Deflator, no weights are allotted to the goods.
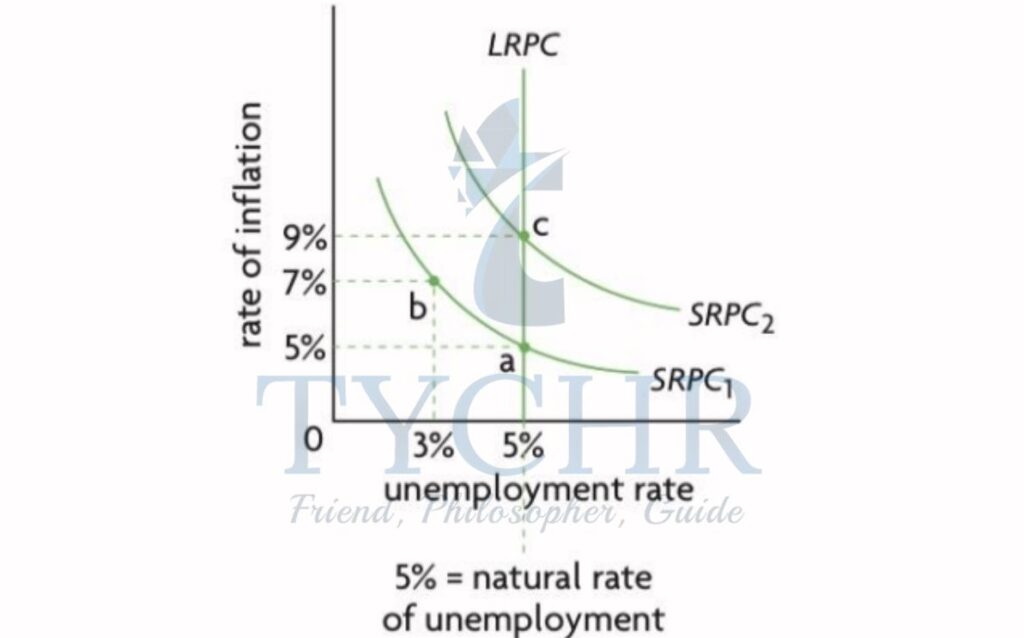
THE PHILLIPS CURVE
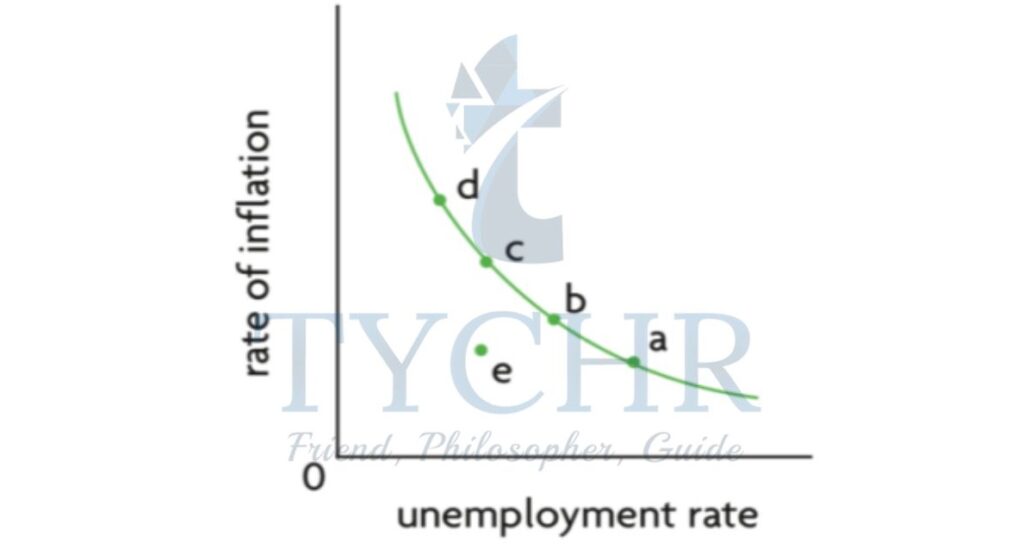
- It shows the relationship between unemployment and inflation.
- Lower the inflation, higher the unemployment rate.
- Aggregate demand also affects Inflation.
- High aggregate demand would lead to low unemployment rate and higher inflation.
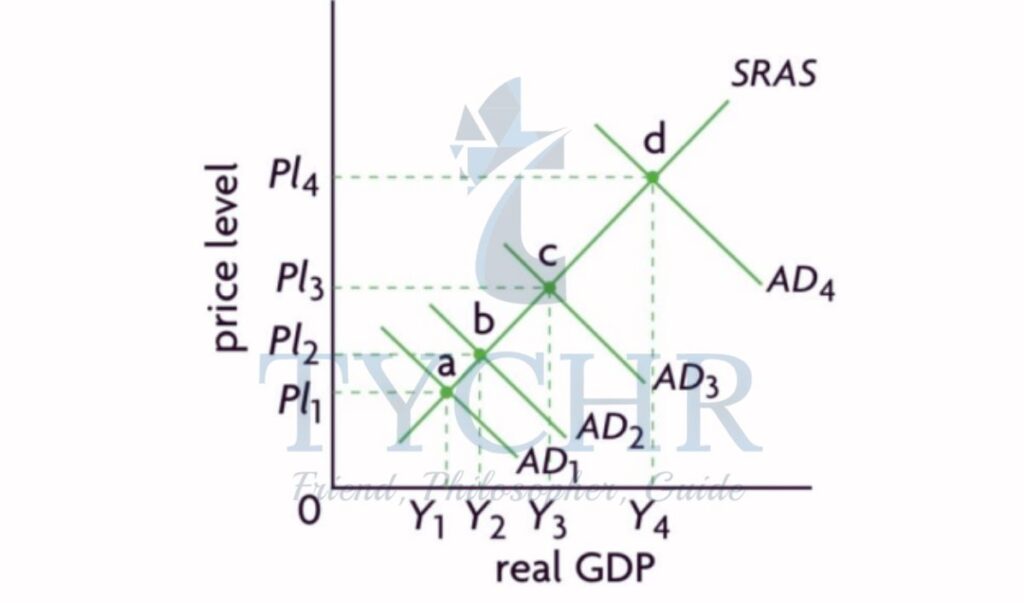
- Stagflation refers to a period where aggregate supply will be stable for long periods of time with inflation and unemployment simultaneously.
- Long Run Phillips Curve and natural rate of unemployment:
