FUNCTIONS
By the end of the chapter you should be familiar with:
- Function
- Domain
- Range
- Linear and Piecewise Functions
- Graph of Functions
- Composite Functions
- Inverse Functions
- One-to-one Function
- Identity Function
- Transformations
FUNCTIONS
A function is a relation from a set of inputs to a set of possible outputs where each input is related to exactly one output.
This means that if the object x is in the set of inputs (called the domain) then a function f will map the object x to exactly one object f(x) in the set of possible outputs (called the codomain).
The notion of a function is easily understood using the metaphor of a function machine that takes in an object for its input and, based on that input, spits out another object as its output.
A function is more formally defined given a set of inputs X (domain) and a set of possible outputs Y (codomain) as a set of ordered pairs (x,y) where x ∈ X and y ∈ Y, subject to the restriction that there can be only one ordered pair with the same value of x. We can write the statement that ff is a function from X to Y using the function notation f : X→Y
DOMAIN
The domain of a function is the complete set of possible values of the independent variable.
How to find the domain?
In general, we determine the domain of each function by looking for those values of the independent variable (usually x) which we are allowed to use. (Usually we have to avoid 0 on the bottom of a fraction, or negative values under the square root sign).
RANGE
The range of a function is the complete set of all possible resulting values of the dependent variable, after we have substituted the domain.
How to find the range?
- The range of a function is the spread of possible y-values (minimum y-value to maximum y-value)
- Substitute different x-values into the expression for y to see what is happening.
- Make sure you look for minimum and maximum values of y.
- Draw the graph.


Example: Find the domain and range of the function f(x) = (√𝑥+ 2)/ 𝑥2+9
Solution: In the numerator (top) of this fraction, we have a square root. To make sure the values under the square root are non-negative, we can only choose x-values greater than or equal to -2.
The denominator (bottom) has x2−9, which we recognise we can write as (x+3)(x−3). So, our values for x cannot include -3 or 3 We don’t need to worry about −3 anyway, because we decided in the first step that x≥−2.
So the domain for this case is x ≥ −2, x ≠ 3, which we can write as [−2,3) ∪ (3,∞).
To work out the range, we consider top and bottom of the fraction separately.
For the numerator, If x=−2, the top has √ (-2+2) = 0. As, x increases value from −2, the top will also increase (out to infinity in both cases).
For the denominator, we break this up into four portions:
When x=−2, the bottom is (-2)2 – 9 = 4 – 9 = -5. We have f(-2) = 0/-5 = 0
Between x=−2 and x=3, (x2 – 9) gets closer to 0, so f(x) will go to – as it gets near x=3.
For x>3, when x is just bigger than 3, the value of the bottom is just over 0, so f(x) will be a very large positive number.
For very large x, the top is large, but the bottom will be much larger, so overall, the function value will be very small.
So, we can conclude the range is (−∞,0] ∪ (∞,0).
We can see in the following graph that indeed, the domain is [−2,3) ∪ (3,∞) and the range is all values of f(x) except f(x)=0.
LINEAR AND PIECEWISE FUNCTIONS
Linear Function: A linear function f(x) = mx+c where m and c are constants, represents a context with a constant rate of change. The constants in the equation are called parameters where m is the gradient and c is the y-intercept.
The gradient is given by = 𝑪𝒉𝒂𝒏𝒈𝒆 𝒊𝒏 𝒚/𝑪𝒉𝒂𝒏𝒈𝒆 𝒊𝒏 𝒙 = (𝒚𝟐 −𝒚1)/(𝒙𝟐−𝒙1) and point gradient form is y – y1 = m(x – x1)
Standard or general form is ax + by + d = 0 where a, b and d are constants.
Example: Find the equation of straight line passing through the points (1,4) and (-3,10). Give your answer in the form ax+by+d=0, where a,b,d .
Solution: We can find the gradient m by m = (𝒚𝟐 −𝒚1)/(𝒙𝟐−𝒙1) = (4 −10)/(1−(−3)) = −3/2
Then find the equation using the point-gradient form, Substituting m and (1,4) gives:
y – 4 = (-3/2) ( x – 1)
3x – 2y + 5 = 0
Piecewise functions: A piecewise function is a function where more than one formula is used to define the output. Each formula has its own domain, and the domain of the function is the union of all of these smaller domains.

Example 1:
Example 2: Evaluate f(x) when x = -3, x = 2 and x = 4. Then graph the function.
 Solution: Evaluating a piecewise function adds an extra step to the whole proceedings. We have to decide which piece of the function to plug-and-chug into. Since -3 is less than 2, we use the first function to evaluate x = -3.
f(x) = x + 1
f(-3) = -3 + 1 = -2
The number 2 is our boundary between life, death, and the two pieces of our function. Tie-breakers go to the second function, though.
f(x) = -2x + 7
f(2) = -2(2) + 7 = 3
The second function continues to be used, from 2 onward to infinity—and beyond, according to some space-faring toys.
f(x) = -2x + 7
f(4) = -2(4) + 7 = -1
Now, to graph the function.
To the left of x = 2, f(x) = x + 1. The graph will go right up to, but not touch, f(2) = 2 + 1 = 3. Then f(x) = -2x + 7 to the right of and including x = 2.
GRAPHS OF FUNCTIONS
The graph of a function f is the set of all points in the plane of the form (x, f(x)). We could also define the graph of f to be the graph of the equation y = f(x). So, the graph of a function if a special case of the graph of an equation.
To find the graph of a function we must follow these steps,
Lets take an example with f(x) = 3x+2Make a two-column table. Label the columns x and f(x).Choose several values for x and put them as separate rows in the x column.
Tip: It is always good to include 0, positive values, and negative values, if possible.
Let’s pick the values of x as -2, -1, 0, 1 and 3 and calculate f(x) by substituting them, after substitution we get the following table –
x | f(x) |
-2 | -4 |
-1 | -1 |
0 | 2 |
1 | 5 |
3 | 11 |
Now that you have a table of values, you can use them to help you draw both the shape and location of the function. Important: The graph of the function will show all possible values of x and the corresponding values of y. This is why the graph is a line and not just the dots that make up the points in our table.
Now graph f(x) = 3x+2
Using the table of values we created above, you can think of f(x) as y. Each row forms an ordered pair that you can plot on a coordinate grid.

Here are the graphs of some common functions-
COMPOSITE FUNCTIONS
Function Composition is applying one function to the results of another.
Let’s take an example– Given f(x) = x2 + 6 and g(x) = 2x – 1, find a) (f ο g)(x)
b) (g ο f)(x)
Solution: a) (f ο g)(x)
= f(2x – 1)
= (2x – 1)2 + 6
= 4x2 – 4x + 1 + 6
= 4x2 – 4x + 7
b) (g ο f)(x)
= g(x2+ 6)
= 2(x2+ 6) – 1
= 2x2 + 12 – 1
= 2x2 + 11
Domain of a composite function
- Find the domain of g.
- Find the domain of f.
- Find those inputs, x, in the domain of gfor which g(x) is in the domain of f. That is, exclude those inputs, x, from the domain of g for which g(x) is not in the domain of f. The resulting set is the domain of f o g (f of g)
Example: Find the domain of (f o g)(x) where f(x) = 5/(x-1) and g(x) = 4/(3x-2)
Solution: The domain of g(x) consists of all real numbers except x = 2/3, since that input value would
cause us to divide by 0. Likewise, the domain of f consists of all real numbers except x =1.
So, we need to exclude that value of x from g(x) for which g(x) = 1.
4/(3x-2) = 1 Set g(x) equal to 1
4 = 3x−2 Multiply by 3x−2
6=3x, x=2 Add 2 on both sides and then divide by 3
So, the domain of f o g is the set of all real numbers except 2/3 and 2. Which can be written as (−∞,23) ∪ (23,2) ∪ (2,∞)
INVERSE FUNCTIONS
An inverse function or an anti-function is defined as a function, which can reverse into another function. In simple words, if any function “f” takes x to y then, the inverse of “f” i.e. “f-1” will take y to x.
Inverse function graph
The graph of the inverse of a function reflects two things, one the function and second the inverse of the function, over the line y = x. This line in the graph passes through the origin and has slope value 1. It can be represented as;
y = f-1(x)
which is equal to; x = f(y)
This relation is somewhat similar to y = f(x), which defines the graph of f but the part of x and y are reversed here. So, if we have to draw the graph of f-1 then we have to switch the position of x and y in axes.
How do we know that an inverse of a function exists?
The original function has to be a one-to-one function to assure that its inverse will be also a function. A function is said to be a one-to-one function only if every second element corresponds to the first value (values of x and y are used only once).
You can apply on the horizontal line test to verify whether a function is a one-to-one function. If a horizontal line intersects the original function in a single region, the function is a one-to-one function and inverse is also a function.
How to find the inverse of a function?
Generally, the method of calculating an inverse is swapping of coordinates x and y. This newly created inverse is a relation but not necessarily a function.
Example: Find the inverse of the function f(x) = ln(x – 2)
Solution: First, replace f(x) with y So, y = ln(x – 2)
Replace the equation in exponential way, x – 2 = ey
Now, solving for x,
x = 2 + ey
Now, replace x with y and thus, f-1(x) = y = 2 + ey
INDENTITY FUNCTIONS
The identity function is a function which returns the same value, which was used as its argument. It is also called an identity relation or identity map or identity transformation. If f is a function, then identity relation for argument x is represented as f(x) = x, for all values of x. In terms of relations and functions, this function f: P → P defined by b = f (a) = a for each a ϵ P, where P is the set of real numbers. Both the domain and range of function here is P and the graph plotted will show a straight line passing through the origin.
Example: Prove f(2x) = 2x is an identity function.
Solution: Given, f(2x) = 2x
Let us put the values of x in the given function.
If x = 1, then;
f(2(1)) = 2(1) → f(2) = 2
If x = 2, then;
f(2(2)) = 2(2) → f(4) = 4
If x = 3, then;
f(2(3)) = 2(3) → f(6) = 6
If x = 0, then;
f(2(0)) = 2(0) → f(0) = 0
Let us try with some negative values of x.
If x =-1, then;
f(2(-1)) = 2(-1) → f(-2) = -2
If x = -2, then;
f(2(-2)) = 2(-2) → f(-4) = -4
If x = -3, then;
f(2(-3)) = 2(-3) → f(-6) = -6
By putting them in a table and graphing them,
x | -3 | -2 | -1 | 0 | 1 | 2 | 3 |
y=f(x) | -6 | -4 | -2 | 0 | 2 | 4 | 6 |

TRANSFORMATION OF GRAPHS
Transformations after the original function
Suppose you know what the graph of a function f(x) looks like. Suppose d R is some number that is greater than 0, and you are asked to graph the function f(x) + d. The graph of the new function is easy to describe: just take every point in the graph of f(x), and move it up a distance of d. That is, if (a, b) is a point in the graph of f(x), then (a, b + d) is a point in the graph of f(x) + d. As an explanation for what’s written above: If (a, b) is a point in the graph of f(x), then that means f(a) = b. Hence, f(a) + d = b + d, which is to say that (a, b + d) is a point in the graph of f(x) + d.
Transformations before the original function
We could also make simple algebraic adjustments to f(x) before the function f gets a chance to do its job. For example, f(x+d) is the function where you first add d to a number x, and only after that do you feed a number into the function f.
Example:
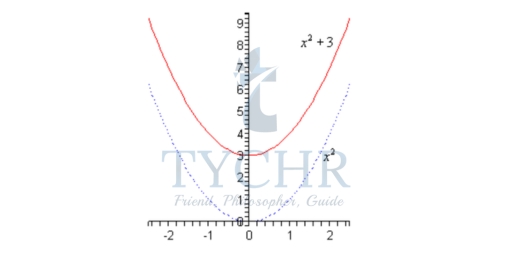
- g(x) = x2 +3
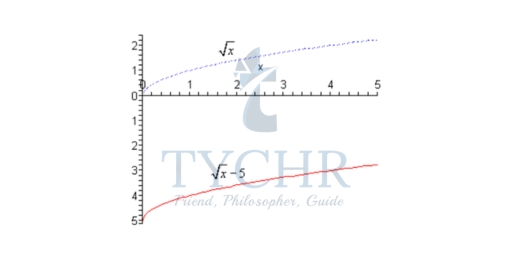
- f(x) = √x– 5