Break- even analysis
Break- even analysis is an important topic from the examination point of view. Therefore, students are suggested to cover this topic thoroughly. We will start with a hypothetical case study so that the basic concepts are understood clearly and you can analyze its implications for a business.
CASE STUDY
Pinnacle Notebook Ltd. is a notebook manufacturing company based out of Pune. It manufactures different types of notebooks for students. The company incurs fixed costs such as rent of the premises, lease payments of assets, etc. The variable costs such as electricity bill, wages of the workers are also incurred. Pinnacle Notebook manufactures 20,000 units of notebook and charges Rs. 120 per notebook on an average in a month. The expected fixed costs for the next few months are Rs. 1,80,000 per week and the variable cost is expected to be around Rs. 10 per notebook, per week. The expected demand for the notebooks is the same as the output i.e. 20,000 units per month.
Contribution refers to the amount of money that remains after the total variable costs associated with the production are deducted from the total sales revenue.
Total Contribution = Total Revenue – TVC
⇨ Total Contribution = (P – AVC) × Q
Therefore, Contribution per unit = P – AVC
Aad Profit = Total contribute – TFC
For Pinnacle Notebook Ltd, let us try to calculate the month’s profit.
TVC = (10 × 20,000 × 4) = 8,00,000
AVC = TVC/ Q = 8,00,000/ 20000 = 40
Contribution per unit = P – AVC = 120 – 40 = 80
Total contribution = 80 × 20000 = 16,00,000
Profit = Total contribution – TFC = 16,00,000 – (1,80,000 × 4) = 16,00,000 – 7,20,000 = 8,80,000
There are three ways in which a business organization can increase the profits. These are:
- By increasing the sales revenue to increase the total contribution.
- By decreasing the variable costs incurred.
- By decreasing the fixed costs by exercising cost control.
Importance of contribution analysis:
- Contribution analysis helps a business organization to set the correct prices of the product to ensure that there is sufficient contribution towards the payment of FC.
- It helps the management to decide which products are to be given precedence in terms of investment. The ones with the higher contribution are given priority in general.
- Contribution analysis helps in proper allocation of the costs to the cost and profit centers.
- This analysis is also helpful in making make-or-buy decisions. The decision is made after comparing the unit contribution of buying and making the product.
- Contribution analysis is vitally important to perform break-even analysis. Break- even is a point where TR = TC (no profit, no loss). For newly established businesses, attaining the break- even point is necessary to move towards stability and profitability in the long run.
Break-even analysis
Break-even analysis is a management decision-making tool drawn on the basis of expected sales and cost. It helps the managers to decide whether the particular product is feasible for production or not, what would be the expected profits, and at which point will the firm break- even. It is essential for the new enterprises to reach break-even point to ensure their sustainability and profitability in the long-term.
In general, a business can be at any of the three situations at any point of time:
- At Loss- When TC > TR
- At profit- When TR > TC
- Helpful in making make-or-buy decisionsAt Break-even- When TR = TC
Steps in performing break-even analysis:
I.) Calculation of break-even point and break-even quantity
Three ways to ascertain break-even point (the point at which the costs are equal to the revenue i.e. there is no profit no loss). Lower BEQ shows that firms will be able to operate at profit in the next few years and vice-versa.
a) TR = TC rule
BEQ (Break-even quantity) = The quantity at which TR = TC. If, TR = TC
⇨ P ×Q = TFC + TVC
⇨ 120Q = 7,20,000 + 40Q
⇨ 80Q = 7,20,000
(Since TVC = Rs. 10 per notebook per week, therefore, TVC for the month = 10Q × 4 = 40Q)
⇨ Q = 7,20,000/ 80 = 9,000
Therefore, BEQ for Pinnacle Notebook Ltd. = 9,000 units of notebook
b)Contribution per unit rule
This rule says that,
BEQ = FC/ Contribution per unit
Using the figures of above case study,
BEQ = 7,20,000/ 80 = 9,000 units.
It is easier and quicker to calculate BEQ with this method.
Now, what is break-even revenue?
The amount of revenue at which the fixed and variable costs of the business would be covered for the firm to break- even.
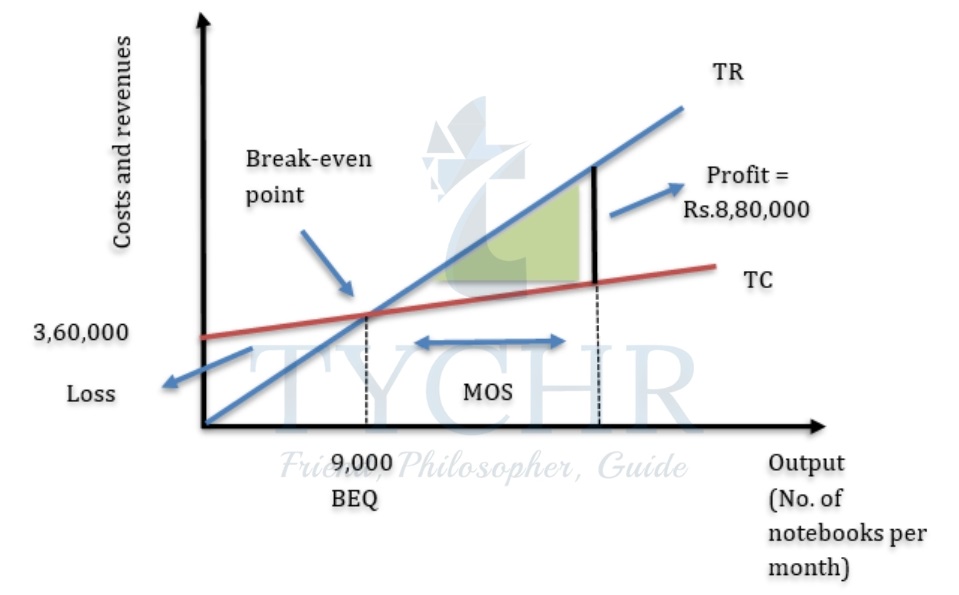
c) Break-even chart/ Graphical method

TC = Total cost = TVC + TFC
TR = Total Revenue
Well, it is particularly important to construct the break-even chart carefully and properly. The steps involved in doing so are:
- x and y axes are plotted. x-axis being the level of output (units) any y-axis being costs and revenues (monetary unit).
- The TC line is drawn and labeled, where TC = TFC
+ TVC. Remember, since TFC is incurred even when the output is zero unlike TVC, therefore, TC lines would always start at the same level as TFC. - The TR line is drawn and labeled, and the TR line starts from the origin since sales revenue is zero when the level of output is zero.
- Now the break-even point is marked at the intersection of TC and TR lines. And the break-even quantity is the level of output at which TC and TR lines intersect. (TR = TC).
II. Calculation of the margin of safety
The margin of safety (MOS) is the difference between the firm’s sales
volume and the break-even quantity.
A firm must have a positive MOS to be able to make profits.
When sales volume > BEQ, MOS is positive => Profit
When sales volume < BEQ, MOS is negative => Loss
In the above case study, Pinnacle Notebook Ltd. produces and sells 20,000 notebooks per month while the quantity needed to break-even is 9000 units.
Thus, MOS = 20,000 – 9000 = 11,000 units (which is positive).
Inferences/ implications of break-even analysis of Pinnacle Notebook Ltd.:
- The break-even point of Pinnacle Notebook Ltd. suggests that the company is breaking even at an output of 9000 units and the company’s output is 20,000 units. Hence, there is a positive MOS and the management of the company can look forward to continuing with the production of notebooks.
- A positive MOS indicates profit. The profits can be increased more by increasing the production or minimizing the costs (by optimum utilization of resources and avoiding wastage).

The break-even point in the diagram is based on expected costs and revenues. The actual break even, profits and losses might differ from the predicted figures due to few reasons which are:
- The short and long-term profits generally differ. In the short run, to attract the customers, the price of the product is reduced leading to higher BEQ but in the long run, the prices might be raised up once customers become loyal. This reduces demand and hence BEQ.
- The change in demand because of the different factors that affect demand.
- Innovation and introduction of new technologies can lead to the production of better products. This might gear sales and profits and the values would surpass the original forecasts.
Benefits of BEA | Limitations of BEA |
It is a useful decision-making tool that helps the management to make realistic predictions about profits and losses of the business. | BEA is based on some assumptions that seem to be unrealistic from the business’s perspective. The assumptions are mentioned in the box below. |
This tool can be used to improve the profit graph of the business in the coming years. | It is a static tool / model and hence, not of much use in a dynamic business environment. |
BEA performed with the help of a break-even chart makes it convenient to draw interpretations and conclusions. The charts are relatively easy to construct and interpret. | BEA’s results solely depend on the data. The data needs to be authentic to avoid wrong results. |
Calculating the margin of safety through BEA helps the managers to assess the risk involved in producing the project. | BEA is only suitable for single product firms that can sell all of their output. |
