Human Systems and Resource Use
Check Out Our Results

OXFORD UNIVERSITY
(QS:3)

IMPERIAL COLLEGE
(QS:6)

CORNELL UNIVERSITY (QS:16)

45/45 (IBDP)
GEORGIA INSTITUTE

43/45 (IBDP)
KELLY SCHOOL
The Tychr’s IB ESS syllabus on Human Systems and Resource Use explores the intricate relationship between human activities and the environment. This topic covers population dynamics, resource management, and strategies for achieving sustainability, making it a crucial part of the IB DP curriculum.
Resource Utilization and Human Systems
8.1 Human Population and Dynamics
8.1.1 Demographic Variables
Demographic Tools
- Crude Birth Rate- is defined as the number of live births per thousand people in a population. The CBR is easy to calculate and the data is readily available. For example:
𝑇𝑜𝑡𝑎𝑙 𝑁𝑢𝑚𝑏𝑒𝑟 𝑜𝑓 𝐵𝑖𝑟𝑡ℎ𝑠𝐶𝑟𝑢𝑑𝑒 𝐵𝑖𝑟𝑡ℎ 𝑅𝑎𝑡𝑒 = 𝑇𝑜𝑡𝑎𝑙 𝑃𝑜𝑝𝑢𝑙𝑎𝑡𝑖𝑜𝑛× 1000 - Population Mortality- is the ratio of live births to the population’s total number of people per thousand. The CBR is not difficult to ascertain and the information are promptly accessible. For example:
𝑇𝑜𝑡𝑎𝑙 𝑁𝑢𝑚𝑏𝑒𝑟 𝑜𝑓 𝐷𝑒𝑎𝑡ℎ𝑠𝐶𝑟𝑢𝑑𝑒 𝐷𝑒𝑎𝑡ℎ 𝑅𝑎𝑡𝑒 = 𝑇𝑜𝑡𝑎𝑙 𝑃𝑜𝑝𝑢𝑙𝑎𝑡𝑖𝑜𝑛 × 1000 - Total Fertility Rate- The total fertility rate is the average number of births per woman of childbearing age. In general, the highest fertility rates are found among the poorest countries, and few LEDCs have made the transition from high birth rates to low birth rates. By contrast, the birth rates have reduced in most MEDCs.
- Natural increase rate (NIR)- is the increase in population as a result of the birth rate exceeding the death rate.
- Doubling time (DT)-relates to the amount of time it takes for a population to double in size, assuming that its natural growth rate remains constant. The formula that follows can be used to get approximate values for it.:
𝐷𝑜𝑢𝑏𝑙𝑖𝑛𝑔 𝑇𝑖𝑚𝑒 (𝑦𝑒𝑎𝑟𝑠) = 70/ 𝐺𝑟𝑜𝑤𝑡ℎ 𝑅𝑎𝑡𝑒 𝑖𝑛 𝑃𝑒𝑟𝑐𝑒𝑛𝑡𝑎𝑔𝑒
8.1.2 Human Population Growth
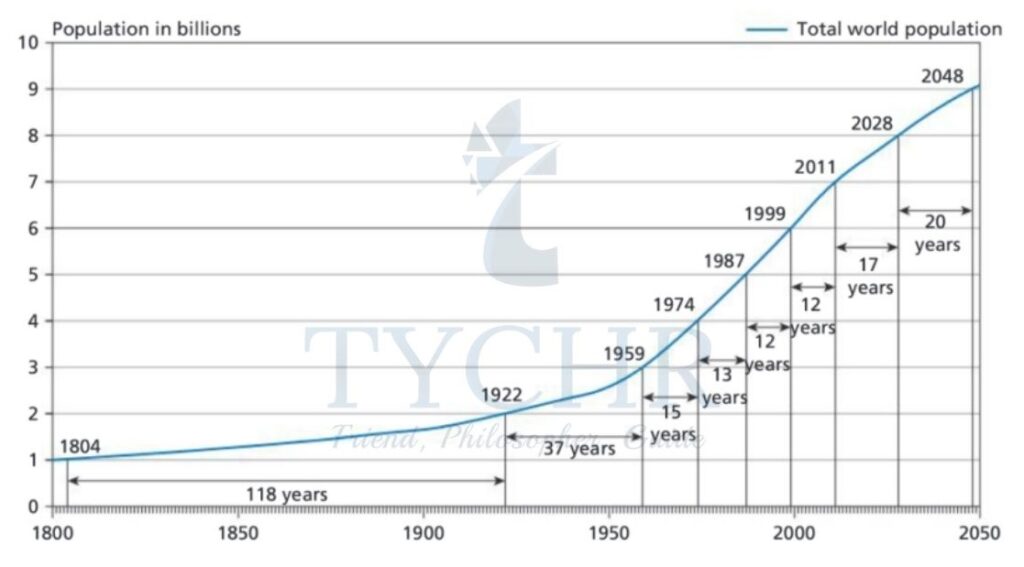
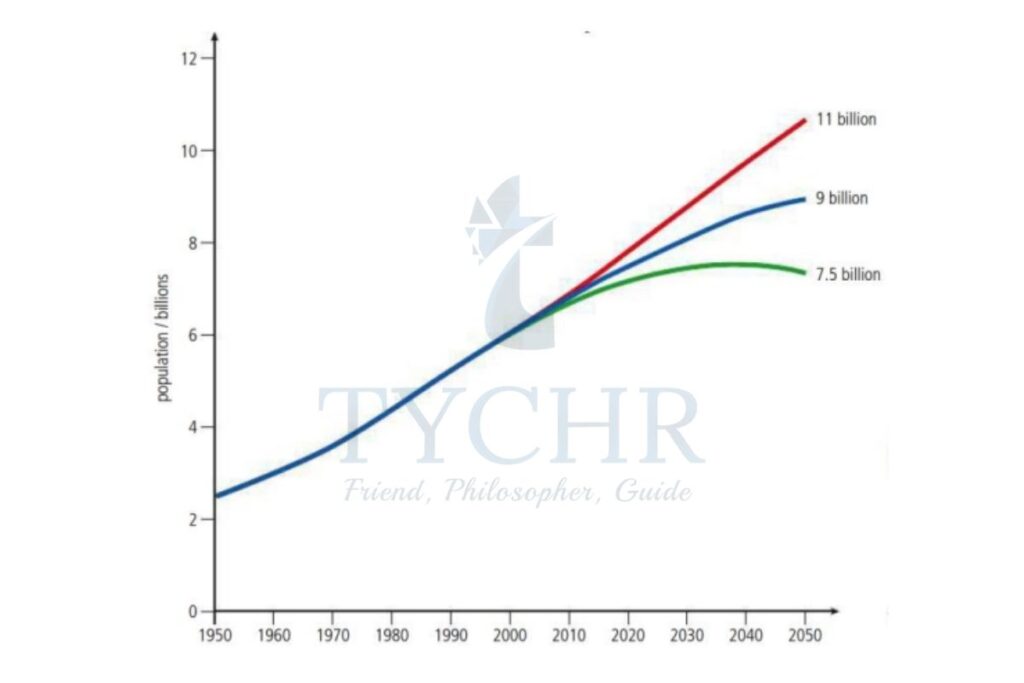
The world’s population is growing very rapidly. Up to 95% of population growth is taking place in less economically developed countries (LEDCs). However, the world’s population is expected to stabilise at about 8.5 billion following a peak at 11 billion.
- Human population growth stresses water systems, agricultural systems, and energy systems.
- The impact of exponential growth is that a huge amount of extra resources are needed to feed, house, clothe, and look after the increasing number of people.
- However, the resource consumption of much of the world’s poor population (i.e. those in LEDCs) is much less than the resource consumption of populations in MEDCs where population growth rates are much lower.
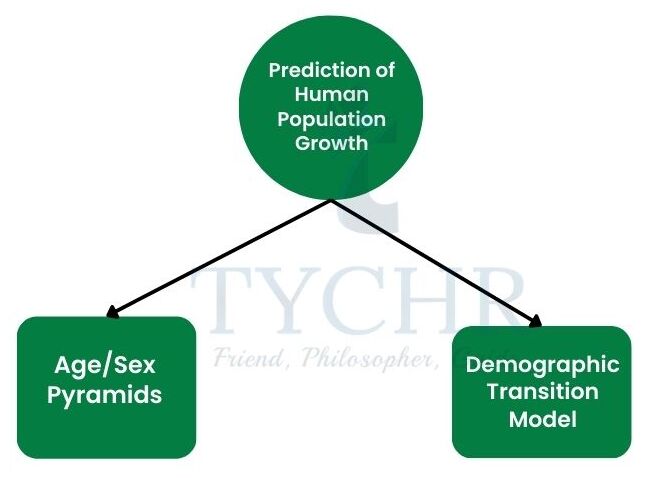
Age/ Sex Pyramids
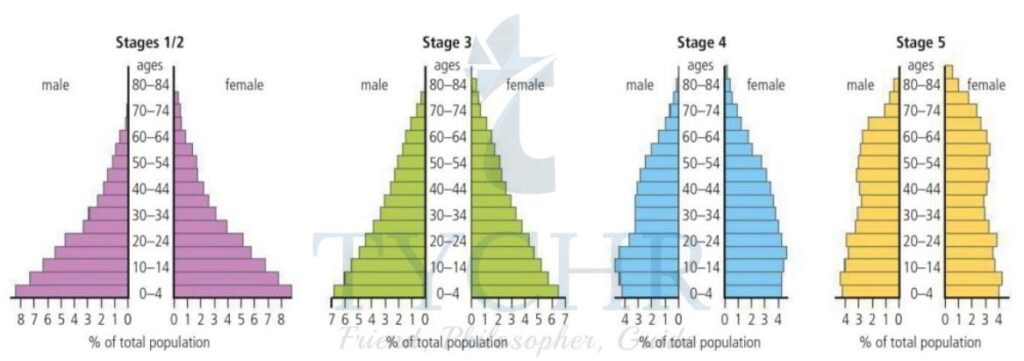
A population pyramid is a bar or line graph on its side showing variations in the age structure and sex structure of a population. Population pyramids tell us a great deal of information about the age and sex structure of a population:
- A wide base indicates a high birth rate
- A narrowing base suggests falling birth rate
- Straight or near vertical sides reveal a low death rate
- Concave slopes characterise high death rates
- Bulges in the slope suggest high rates of in-migration
- Indentations in the pyramid may indicate out-migration or age-specific deaths.
Demographic Transition Model
The general demographic transition model (DTM) shows the change in population structure from LEDCs to MEDCs.
Population Dynamics
- Factors influencing the birth rate- social, political, cultural, historical, religious, economic, and social factors. For example, in some cultures, especially agricultural ones, there is an advantage in having more children to work on the land. In contrast, in cultures where women are employed in the workforce, such as in Singapore, the birth rate may be very low.
- Factors influencing the death rate- include the age-structure of the population, availability of clean water, sanitation, adequate housing, reliable food supply, prevalence of disease, provision of healthcare facilities, type of occupation, natural hazards, civil conflict and war, and chance factors. Social and economic factors have a major influence on death rates – poor people are far more vulnerable to the risk of early death, due to a combination of poor living conditions, poor diet, lack of access to clean water, and sanitation.
National & International Development Policies
The most famous anti-natalist policy is China’s one-child policy.
- It was introduced in 1979 and limited most Chinese families to one child.
- It is thought that China’s population would now be 400 million people larger if the one-child policy did not exist.
- The prospect of an ageing society in which one worker is left to support two parents and four grandparents led China to relax the one-child policy.
- In 2015, amid fears that the size of the working population was set to decline, the Chinese government changed the policy to allow couples to have two children.
Singapore is an example of a country that had an anti-natalist policy and changed to a pro-natalist policy.
- It changed because its fertility rate had dropped to below 1.25 and the workforce was getting smaller.
- If a family could afford to have more than three children, the government offered incentives.
- Despite the incentives, Singapore’s fertility rate has remained low.
- Women continue to play an active role in the workforce and are choosing jobs rather than having children.
International Policies that Affect Population Growth
- In 2000 the United Nations announced the Millennium Development Goals (MDGs) whose aim was to address issues of poverty and inequality.
- In 2015 the MDGs were replaced by the Sustainable Development Goals (SDGs). Goal 3 aims to ensure healthy lives and promote wellbeing for the whole population at all ages.
- One of its targets is improving reproductive, maternal, newborn, and child health.
8.2 Resource Use in Society
Renewable Natural Capital
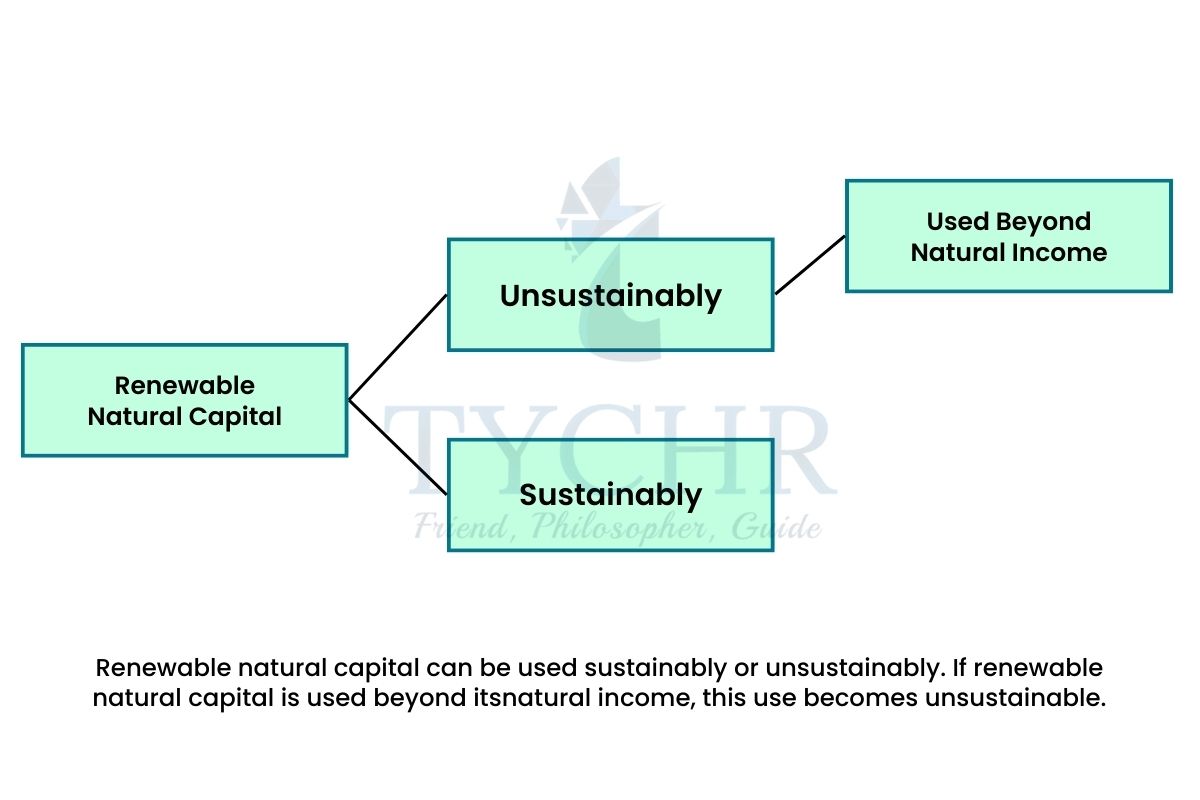
- Natural Capital is the total quantity of natural resources. Some natural capital is non-renewable, for example fossil fuels, soils, and minerals. These can only be replaced or renewed over a very long timescale and millions of years in the case of fossil fuels.
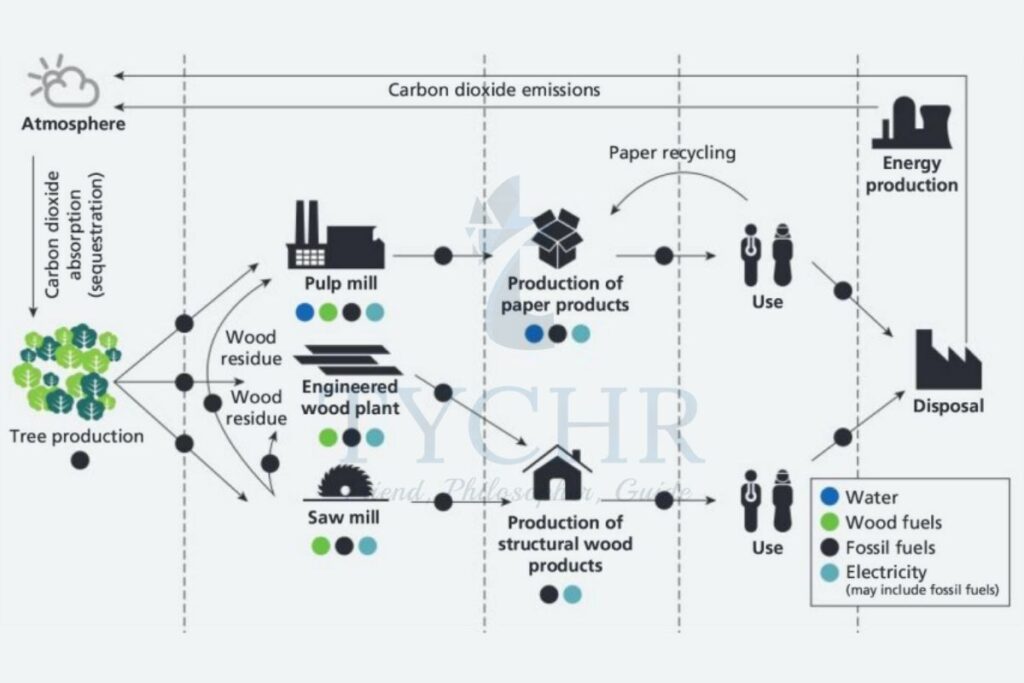
- Although a resource may be harvested in a sustainable way, i.e. the amount harvested is less than the annual recharge; the way in which it is extracted, transported and processed may cause environmental and social damage, thereby making this type of harvesting of natural capital unsustainable.
Sustainable & Unsustainable Use of Natural Capital
- Sustainability is ensuring that resources are not degraded (i.e., that natural capital is not depleted and/or polluted) so that future generations can continue to use the resource while living within the means of nature (i.e., on the “interest” or sustainable income generated by natural capital).

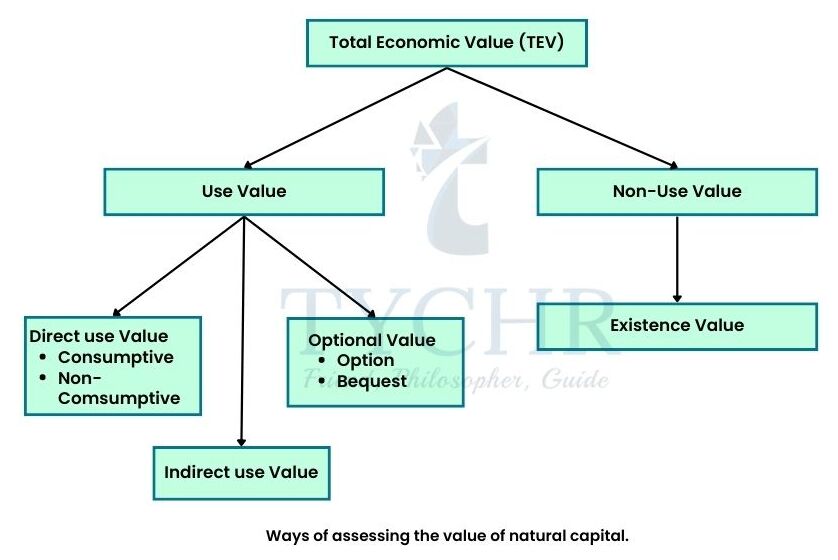
Figure 8 Ways of assessing the value of natural capital. - An example of irresponsible use of a resource concerns groundwater. Pollutants from agricultural products and run-off from storage tanks, landfills, and septic tanks are reducing the water quality. Unsustainable extraction from groundwater sources (aquifers) means that water tables are lowered, which can lead to the intrusion of saltwater in coastal areas and further contamination
of the supply (e.g. the Gaza Strip). - Water shortages can lead to tensions and conflict over the limited resource (e.g. the Israeli Palestinian Conflict).
Dynamic Nature and Concept of a Resource
Natural capital’s value fluctuates over time. Resources change in value over time as new technology makes them more or less useful and therefore more or less valuable. In the Middle Ages oil was used to seal wounds, but in the 20th century it became the world’s leading fuel.
8.3 Solid Domestic Waste
Types of Solid Domestic Waste
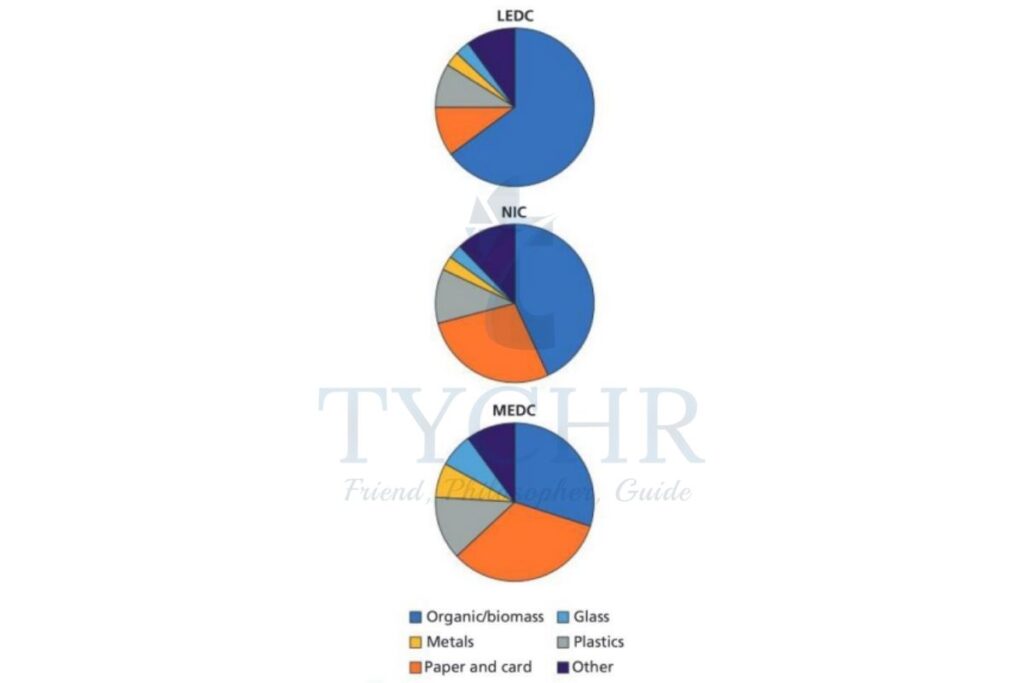
There are many types of solid domestic waste. In an MEDC solid domestic waste usually consists of the following:
- Organic waste from kitchen or garden, including waste wood
- (20–50%)
- Paper/packaging/cardboard (20–30%)
- Glass (5–10%)
- Metal (less than 10%)
- Plastics (5–15%)
- Textiles (less than 5%)
- Electrical appliances, e.g. computers/fridges etc. (less than 5%).
With increasing wealth there is:
- A decrease in organic waste/biomass waste
- An increase in paper and cardboard
- An increase in plastic waste
- An increase in metal and glass waste.
Non-Biodegradable Pollution
Plastic | Batteries | Electronic Waste |
|
|
|
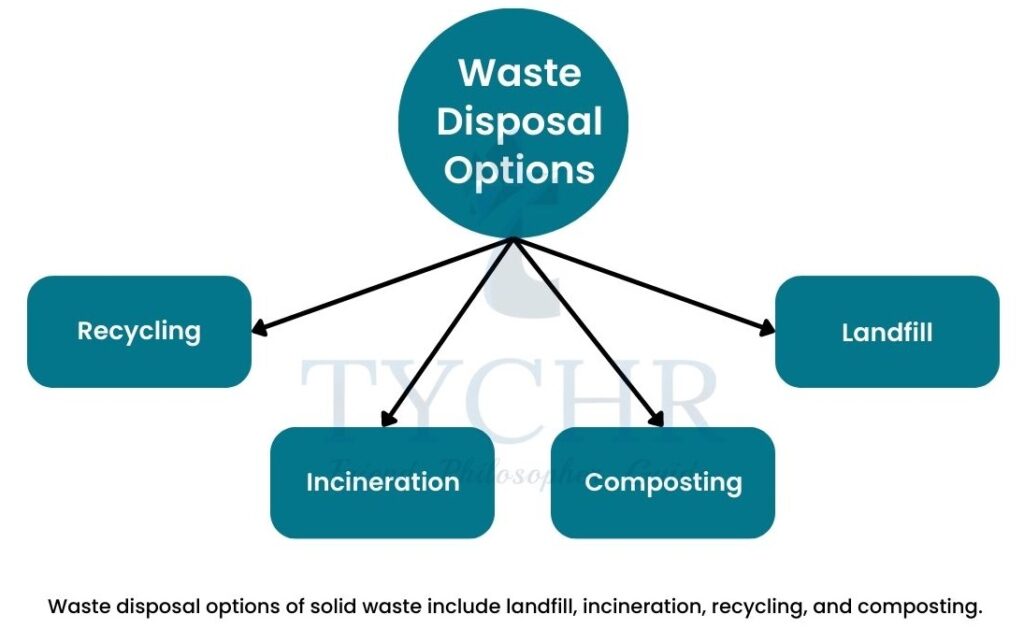
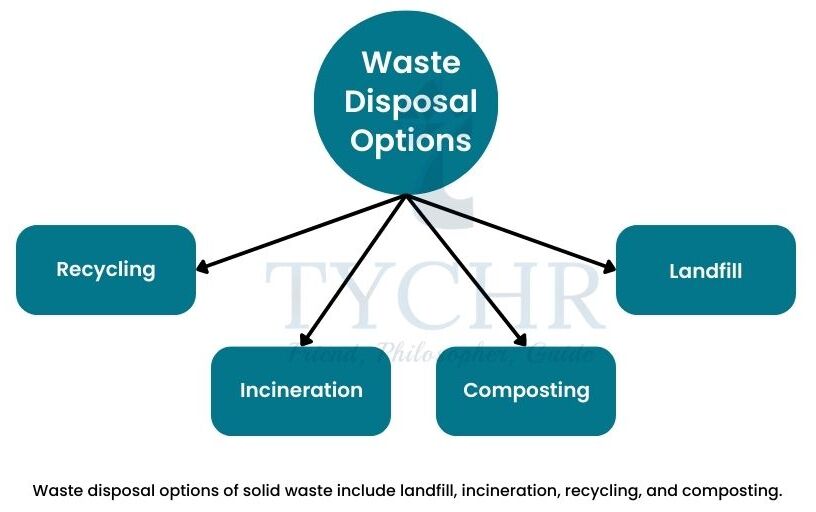
Disposal Options for SDW
- Recycling- Recycling is the processing of household and industrial waste so that it can be used again.
- Composting- Composting is the decomposition of biodegradable material and its use as a fertiliser in soil.
- Landfill- Landfill is the dumping of material in a hole in the ground or on the ground.
- Incineration- Incineration is the burning of household and industrial waste so that it is reduced in volume.
- Reduction- Reduction of waste means using fewer resources to meet the needs of the population.
Strategies for Managing SDW
- Altering human activity-includes food waste composting and consumption reduction.
- Controlling release of pollutants – In order to encourage recycling and reuse initiatives, governments enact legislation, tax SDW collection, and tax disposable items.
- Utilising SDW in trash-to-energy programs, reclaiming landfills, and carrying out initiatives to eliminate plastics from the Great Pacific Garbage Patch (cleanup and restoration)
The Great Pacific Garbage Patch
The Great Pacific Garbage Patch
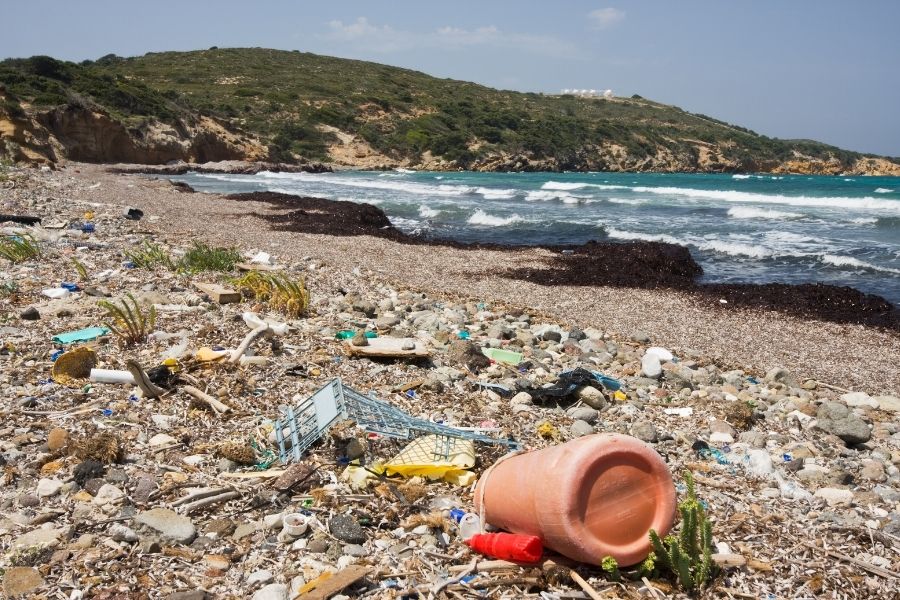
The Great Pacific Garbage Patch is an area of marine debris that shifts its exact position every year. It remains within the North Pacific Gyre as ocean currents confine it.
Estimates of its size vary from 7,00,000 km2- 1,50,00,000 km2 – between 0.41% and 8.1% of the size of the Pacific Ocean. Plastics never biodegrade. They do not break down into natural substances. Instead they go through a photodegradation process, splitting into smaller and smaller particles that are still plastic.
Problems caused by plastic:
- Plastic fouls beaches throughout the
world and reduces potential income from
tourism and recreation. - Plastic entangles marine animals and
drowns them, strangles them, and makes them
immobile. - Plastic garbage when washed ashore destroys habitats.
- Marine animals are entangled in plastic, drowned, strangled, and rendered immobile.
- Plastic gets inside ships propellers and keels making ship maintenance more expensive.
- Plastic does not degrade; it also makes an ideal medium for the transfer of invasive species.
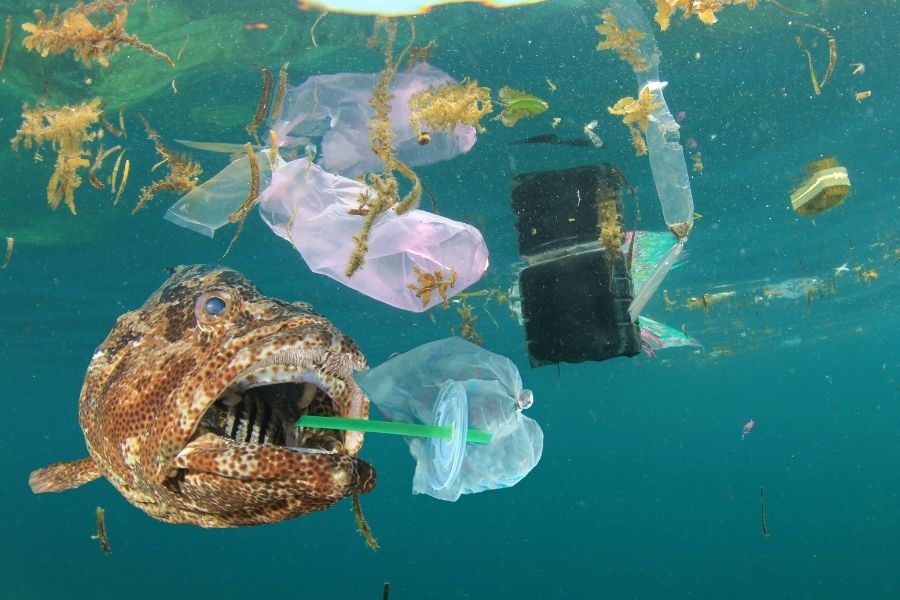
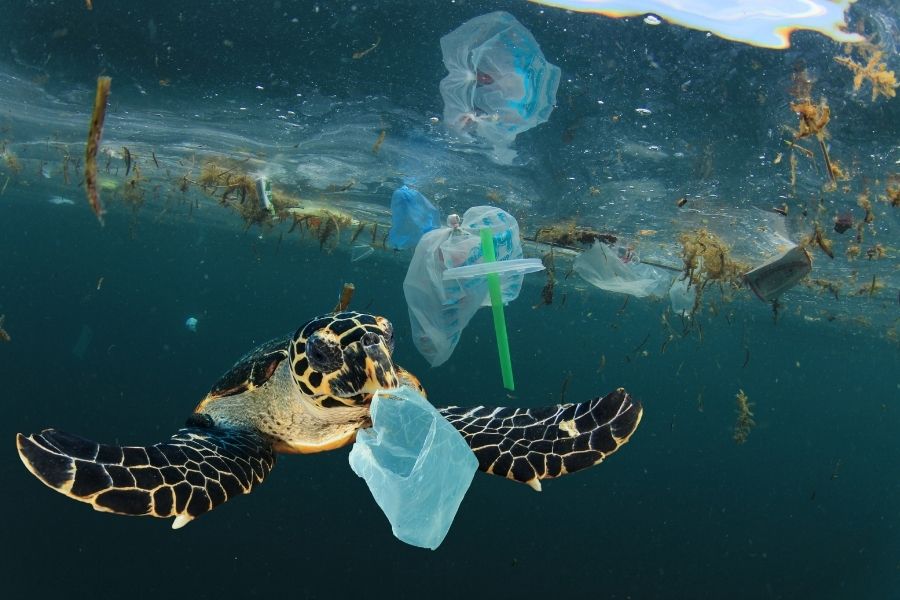
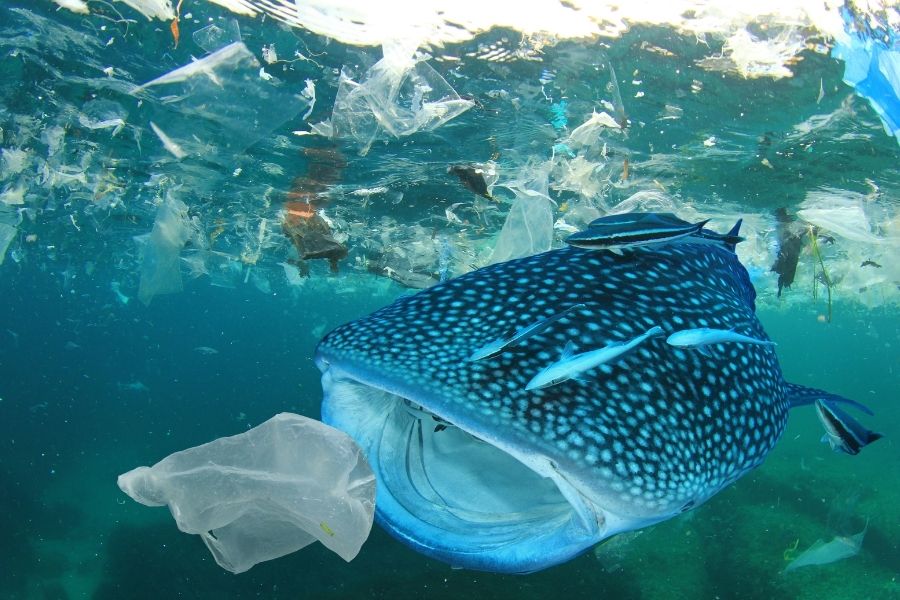
Indirect Harm via the Food Chain- On the microscopic level, debris can absorb organic pollutants from seawater, including PCBs, DDT and PAHs. Aside from toxic effects,some of these are mistaken by the endocrine system as estradiol, disrupting hormone levels in affected animals. These toxin-containing plastic pieces are also eaten by jellyfish, which are then eaten by fish and then by humans.
8.4 Carrying Capacity & Ecological Footprints
Carrying Capacity
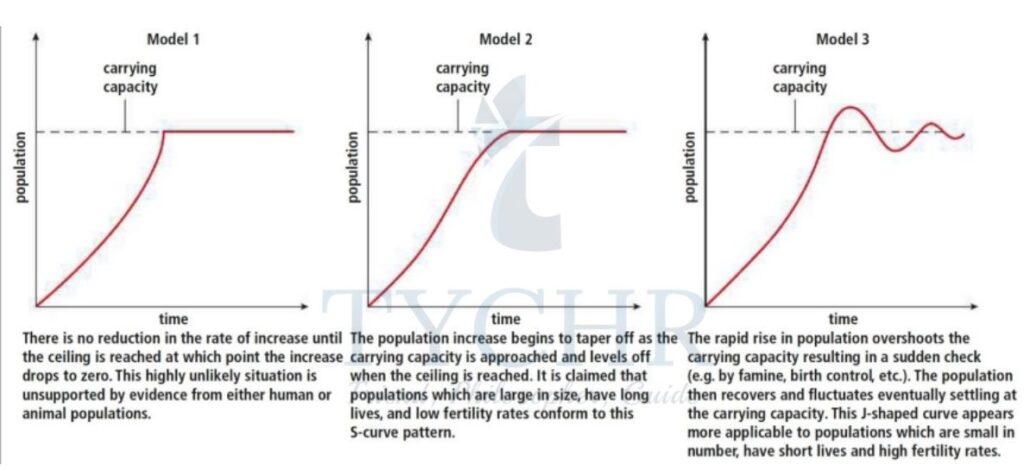
Carrying capacity is the maximum number of a species or “load” that can be sustainably supported by a given environment. Although it is possible to estimate the carrying capacity of an environment for a given species, based on its size and the food and water supply it contains, it is difficult to apply to human populations for many reasons.
Optimum, Over and Under Population
- Optimum population is the number of people who, when using all the available resources, will produce the highest per capita economic return. It is the point at which the population has the highest standard of living and quality of life.
- Overpopulation occurs when there are too many people relative to the resources and technology locally available to attain the optimum standard of living. They suffer from natural disasters such as drought and famine and are characterised by low incomes, poverty, poor living conditions, and a high level of emigration.
- Under-population occurs when there are far more resources in an area (e.g. food production, energy and minerals) than can be used by the people living there in order to reach the optimum population.
Population Growth and Food Resources
Thomas Malthus’s Essays on the Principle of Population Growth
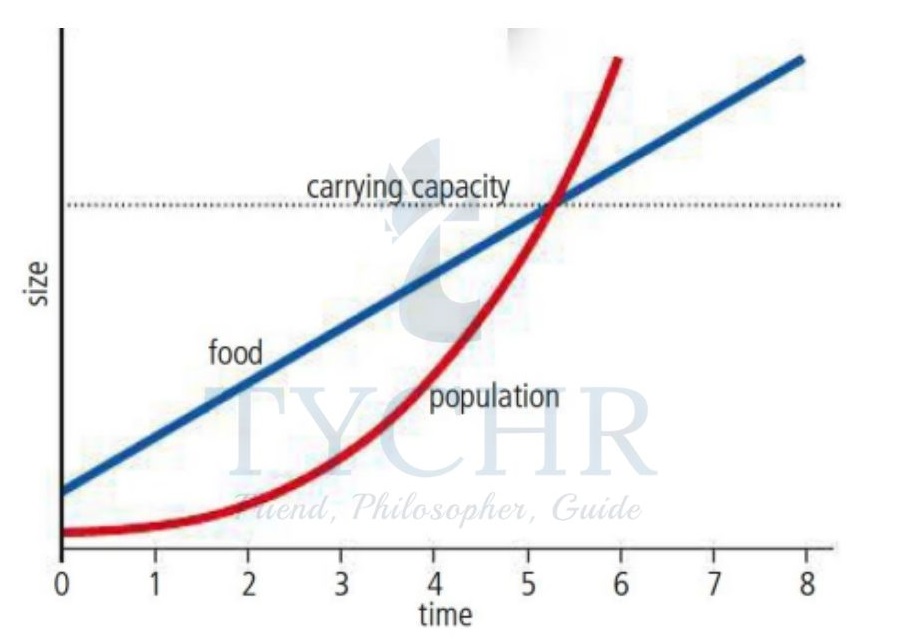
He was of the opinion that the optimal population size in terms of food supply was limited, and that any population growth beyond this point would result in a decline in standard of living, war, famine, and disease. His theory was based on two principles:
- In the absence of checks, the population would grow at a geometric or exponential rate and could double every 25 years.
- Food supplies at best increase at an arithmetic rate.
These principles state potential and not the actual growth of population and food production. Thus, the limit of food production creates a block or ceiling to the population growth in a given country.
Changing Carrying Capacities
Human carrying capacity of the environment is determined by:
- Rate of energy and material consumption
- Level of pollution
- Interference with environmental life- support systems.
Ecological Footprints
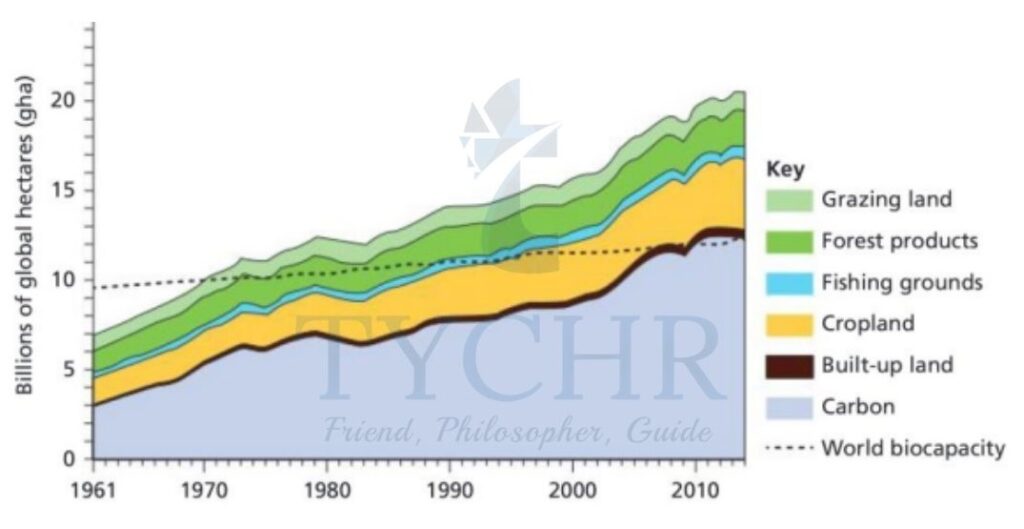
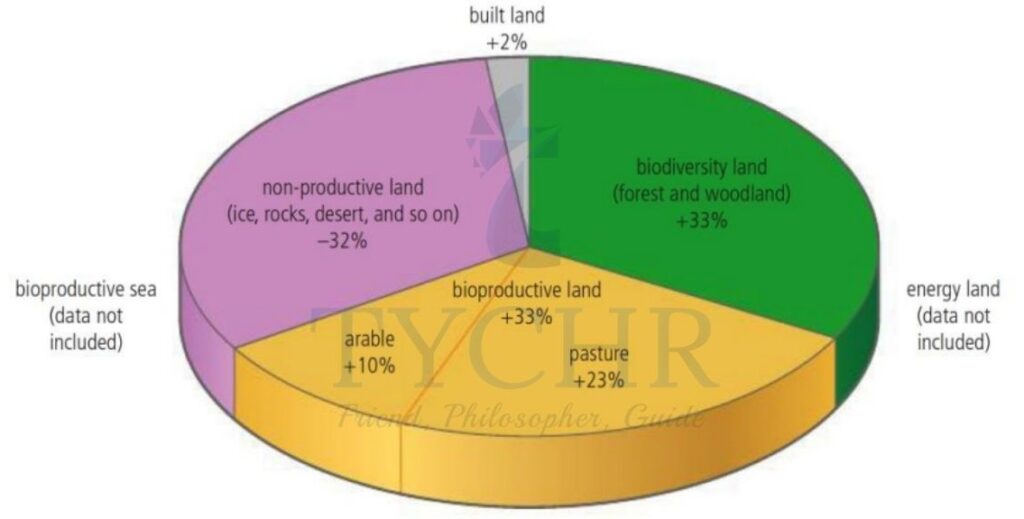
The area of land needed to accommodate all of a population’s waste and provide all of its resources is known as its ecological footprint. Instead of referring to the population that a given area can sustainably support, it means the area needed to support a given population.. It is measured in global hectares (gha).
Advantages and Disadvantages of Using Ecological Footprint as a Model
The two broad categories that contribute to a person’s or a nation’s ecological footprint are:
- Land required to provide necessary resources, e.g. food, agriculture, housing, urbanisation, industry, water supply
- Land required for assimilation of wastes, e.g. vegetation that provides a sink for carbon waste and areas of landfill.
Advantages | Disadvantages |
|
|
Ecological Footprint in LEDCs & MEDCs
LEDCs | MEDCs |
|
|
Unsustainable Footprints
- The demand for consumer goods has increased dramatically since the 1960s, putting the world’s resources under great pressure.
- The world is reaching its carrying capacity.
- Many have argued that the over-consumption of resources, pollution, and degradation of the environment will lead to a decline in the population from around 2040.
- The limits to Growth model has a pessimistic view of population and resources. It predicts that the human population would outstrip the ability of the Earth to provide sufficient resources for the population.
- However, many people believe that human carrying capacity can be increased through technological developments. They argue that the Earth can hold more people if we learn to use energy and resources more efficiently. Technological improvements include irrigation and fertilisers. Crops could be grown in nutrient- enriched water. This is known as hydroponics. High-yielding varieties (HYVs) of plants could be used.
A strong understanding of Human Systems and Resource Use is essential for success in IB ESS. Tychr’s expert HL and SL IB ESS tutors offer personalized guidance to help students navigate complex topics, clarify doubts, and approach exams with confidence. With the right support, excelling in ESS becomes achievable and enjoyable.

