1.) How does the diameter of the pendulum wire affect the damping constant of the pendulum?
Experimental Setup:
A pendulum setup is made in accordance with the constant variables. The light gate is placed in a way where the pendulum passes between the edges of it without disturbance. A data logger collects the data as the pendulum passes between the light gate for 90 seconds. Using this data, you will be able to calculate the damping constant.
Independent Variables:
Diameter of the pendulum wire
Constant Variables:
Mass of mass hanger, Length of wire, Initial place from which the pendulum was released (angle at which it was released from) and person letting go of the mass hanger.
Dependent Variables:
The velocity of the pendulum for 90 seconds
2.) Experimental Investigation of Torricelli’s Law?
Experimental Setup:
There is a cylindrical container, a funnel, a ruler placed horizontally at a specific height under the orifice and a ruler to measure the height of the water in the cylindrical container. The setup is set in a way to allow simultaneous measurements of both the speed of the existing water and the change of the height of the level of water in the container. The speed of the water is obtained implicitly since by measuring the distance the water exiting travels over a period of time yields the speed of the water.
Independent Variables:
Height of the empty space in the bottle
Controlled Variables:
Distance from orifice to the ground, Temperature of water, Medium of liquid, Size of orifice
Dependent Variables:
Horizontal distance from the Orifice
3.) Investigating the relationship between the pressure of a soccer ball and its rebound height
Experimental Setup:
Using a meter scale, the drop height for the soccer ball on the wall is marked. One person will drop the soccer ball from this constant height as the pressure of the ball varies. Once it drops, you will have to record a video to see how far up the ball bounces back. This is your dependent variable. Many trials can be taken to obtain an average value.
Independent Variables:
Pressure of the ball
Constant Variables:
The drop height of the soccer ball, the surface the ball is dropped on to, environmental conditions like wind, temperature and air pressure
Dependent Variables:
Bounce height of the soccer ball
4.) Relationship between Brewster’s Angle and Refractive Index
Experimental Setup:
The purpose of this exploration is to observe how the Brewster’s angle changes in accordance to different refractive indices. The indices were varied using different masses of white sugar dissolved in tap water. A constant wavelength of light was also used to see how the Brewster’s angle varied proportionally to the changing refractive index. The set-up is inspired by a non-invasive form of medical testing for the concentration of glucose in blood by measuring the refractive index in the aqueous humor of the eye.
Independent Variables:
Different masses of white sugar
Constant Variables:
Wavelength of the light, Amount of tap water
Dependent Variables:
Brewster’s Angle, Refractive Index
5.) Investigating power in a human motion using the double pendulum mechanism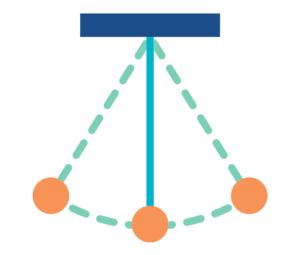
Experimental Setup:
In this experiment, you will be able to find the optimum angle and lengths in which the hand should be for maximum power delivery. However, this would be more of an investigation. A double pendulum is constructed using wood to represent the hand. By changing the angle of pendulum 1 the final power produced by that motion changes. Additionally, the length of both pendulums will also change because not everyone’s hand measurements are the same. Furthermore, a simulation software will also be used to compare the results.
Independent Variables:
The initial angle of Pendulum 1, Length ratio of both pendulums (L1/L2)
Dependent Variables:
Time period (s) in the first cycle, Maximum Kinetic Energy (Joules) in the first cycle, Maximum Power (J s-1) delivered in the first cycle
6.) To stimulate the kinetic theory of gasses to study the distribution of velocities and its variation with temperature
Experimental Setup:
Write a code to simulate motion of gas molecules in a box by using the Maxwell Boltzmann distribution function to find velocity distribution at various temperatures.
Independent Variables:
Temperature, number of particles/molecules
Constant Variables:
Dimension of the box, number of iterations
Dependent Variables:
Velocity distribution
7.) To calculate the coefficient of friction by sliding a box down a ramp
Experimental Setup:
A long wooden plank with a uniformly smooth surface(like glass) is placed slanted on a vertical Support with a box sliding down. The distance traveled by the box and and the time taken is measured to calculate the coefficient of friction of the smooth surface
Independent Variables:
Length of the plank, surface
Controlled Variables:
Angle of tilt of the ramp, air resistance
Dependent Variables:
Time taken
8.) To calculate acceleration due to gravity by dropping a magnet through a pipe
Experimental Setup:
Take a pipe and coil a wire around it at a distance apart. Now connect a microammeter to both ends of the wire to measure the current in the coil when the magnet passes through it. Measure the time between the current induced in both the coils which can be utilized to find the acceleration due to gravity.
Independent Variables:
Distance between the coil
Constant Variables:
Number of turns in the coil, strength of the magnet
Dependent Variables:
Time taken for the magnet to pass through both the coils.
9.) To identify the refractive index of a liquid by measuring the apparent shift in the image
Experimental Setup:
A transparent beaker with the desired liquid filled up. Now immerse a metal rod in the liquid and you will observe an apparent shift in the image of the rod which can be measured to calculate refractive index of the fluid
Independent Variables:
Type of fluid
Constant Variables:
Temperature, material of the beaker, thickness of the rod
Dependent Variables:
Shift of the image
10.) Effect on the double slit interference pattern on introducing a thin film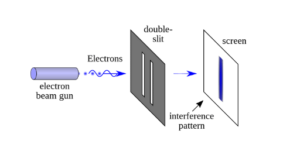
Experimental Setup:
After setting up a young’s double slit experiment when we observe an interference pattern on the screen we can manipulate the pattern by introducing thin films of varying widths in front of one of the slits which will in turn move the interference pattern on the screen because of the change in path difference of the interfering waves
Independent Variables:
Thickness of the film, refractive index of the thin film
Constant Variables:
Distance between slits and screen, separation of the slits, wavelength of the light source
Dependent Variables:
Shift of the interfering pattern
11.) To calculate tension on a string using melde’s apparatus
Experimental Setup:
Using Melde’s apparatus we can set up a standing wave in a string of different materials which can be used to measure the wavelength of the interfering wave.The wavelength can then be used to deduce speed of the wave in the string which in turn helps us to measure tension in the string.
Independent Variables:
Frequency of the wave, material of the string
Constant Variables:
Length of the string
Dependent Variables:
Wavelength of the standing wave
12.) To study efficiency of a electric motor with varying temperature
Experimental Setup:
Set up an electric motor to convert electric current into mechanical work in a chamber and then study efficiency of the motor by lifting weights at varying temperatures. Note down the time taken to lift a fixed distance and use it to measure the performance efficiency of the motor
Independent Variables:
Temperature at which the experiment is done
Controlled Variables:
Type of motor, distance lifted
Dependent Variables:
Time taken to lift the weights through the same distance at different temperature

13.) Temperature dependence of resistance made up of metal and semiconductor
Experimental Setup:
Connect the sample with a voltage supply with ammeter and voltage connected across the sample to measure the current flowing through the sample and potential difference across the sample. After waterproofing the sample, immerse the sample in a beaker containing water. Start heating the water and measure the variation of voltage and current at different temperatures. Repeat the same for the other samples as well
Independent Variables:
Voltage applied, Temperature of the water
Constant Variables:
Thickness of the insulation
Dependent Variables:
Current measured
14.) To verify the Stefan Boltzmann law and further calculating the Stefan’s constant
Experimental Setup:
We use an Incandescent Bulb with Tungsten filament and pass current through it and as the amount of current increases, the filament heats up and temperature of the bulb increases as well
Independent Variables:
Current, voltage
Constant Variables:
Dependent Variables:
Resistance of the filament
15.) Effect of density on the refractive index of a colloidal solution
Experimental Setup:
Creating colloidal solutions of two immiscible substances such as oil and water and altering the density with different types of oil and measuring the refractive index caused by the solution when light of a certain intensity is incident upon the solution
Independent Variables:
- Density of oil
- Different types of oil
Dependent Variables:
Refractive index
16.) To what extent does temperature affect a rubber band’s propulsion
Experimental Setup:
Heating rubber bands of the same kind and measuring the distance travelled by an object such as paper once propelled from the rubber band
Independent Variables:
Temperature
Dependent Variables:
Propulsion due to rubber band
17.) Effect of smoothness of a surface on the momentum of a object and resulting impulse due to collision with a stationary object
Experimental Setup:
Rolling a ball or spherical object across various surfaces of different textures and calculating the impulse occurring when colliding with a stationary object of the same kind
Independent Variables:
Smoothness of a surface
Dependent Variables:
Momentum of an object Impulse
18.) How does the velocity of air affect its pressure according to the Bernoulli principle?
Experimental Setup:
A wind tunnel will be constructed to control the air velocity. A pressure gauge will be placed at the entrance and exit of the wind tunnel to measure the air pressure. The air velocity will be increased in increments and the corresponding air pressure will be recorded. The data will be plotted on a graph to show the relationship between air velocity and air pressure according to the Bernoulli principle.
Independent Variables:
Air velocity
Dependent Variables:
Air pressure
19.) How does the size of the racket head affect the location of the dead spot and sweet spot on a tennis racket?
Experimental Setup:
The experiment will consist of hitting a ball at different points on the racket head and measuring the vibration that is produced. The location of the dead spot and sweet spot will be determined by the point on the racket head that produces the least and most vibration respectively. A graph will be plotted to show the relationship between racket head size and the location of the dead spot and sweet spot.
Independent Variables:
Racket head size
Dependent Variables:
Location of dead spot and sweet spot
20.) How does the rate of change of magnetic flux affect the induced electromotive force in a coil?
Experimental Setup:
A coil of wire will be placed inside a magnetic field, and the induced electromotive force will be measured as the magnetic field strength is varied. A graph will be plotted of the induced electromotive force versus the rate of change of magnetic flux. This will help verify Faraday’s Law of Electromagnetic Induction, which states that the induced electromotive force in a coil is proportional to the rate of change of magnetic flux.
Independent Variables:
Rate of change of magnetic flux
Dependent Variables:
Induced electromotive force
21.) Investigating the Ideal Gas Law
Experimental Setup:
This is a simulation based experiment. The simulation will consist of a fixed container of an ideal gas confined into space. To investigate the Gas Law for the gas in this fixed container, a simulation can be created that varies two variables out of pressure, volume and temperature and see how the third one is affected. This can be repeated thrice for each of the variables. There will be three graphs (one for each): Pressure vs temperature, Volume vs temperature and Pressure vs volume. The formula that is used is PV = nRT
Independent Variables:
Pressure, temperature and volume of a gas
Dependent Variables:
Pressure, temperature and volume of a gas
22.) How does the Young’s modulus of different materials affect their ability to withstand stress and strain?
Experimental Setup:
The experiment will involve testing the Young’s modulus of various materials, such as steel, aluminum, and rubber, by suspending a weight from a material and measuring the deformation it experiences. The cross-sectional area, length, and temperature of the material will be controlled and kept constant. The results will be compared and analyzed to determine the Young’s modulus of each material and how it affects their ability to withstand stress and strain.
Independent Variables:
Type of material (Steel, Aluminium and Rubber)
Dependent Variables:
Stress and strain of the material
23.) How do different types of guitar strings affect the harmonics produced by the strings?
Experimental Setup:
The experiment will consist of recording the sound produced by different types of guitar strings when they are plucked. The harmonics produced by the strings will be analyzed using a spectrograph and compared between the different types of strings. A graph will be plotted to show the relationship between the type of strings and the harmonics produced.
Independent Variables:
Type of guitar strings
Dependent Variables:
Harmonics produced by the strings
24.) How does the mass of dust accumulation on a solar panel affect its efficiency in converting solar energy into electrical energy?
Experimental Setup:
A solar panel will be placed in an open environment where it will be exposed to dust. The solar panel will be cleaned at regular intervals, and the efficiency of the solar panel will be measured using a photovoltaic cell. The efficiency will be measured by calculating the ratio of the output power to the input power. A graph will be plotted to show the relationship between the mass of dust accumulation and the efficiency of the solar panel.
Independent Variables:
Mass of dust accumulation on the solar panel
Dependent Variables:
Efficiency of the solar panel in converting solar energy into electrical energy
25.) How does the mass added to an inflated balloon affect its terminal velocity when dropped from a certain height?
Experimental Setup:
The experiment will consist of inflating balloons of the same size and dropping them from the same height, but with different added masses. The terminal velocity of each balloon will be measured using a high-speed camera and time-of-flight analysis. A graph will be plotted to show the relationship between the mass added to the balloon and the terminal velocity.
Independent Variables:
Mass added to the balloon
Dependent Variables:
Terminal velocity of the balloon
1.) How does the temperature of a bouncy ball affect the coefficient of restitution?
Experimental Setup:
A launch platform is made from which the bouncy ball is dropped from. Once it is dropped, a video is shot of its movement. Using the video, the rebound height is observed using the graph sheet placed next to it. To heat the ball, it is kept in water baths inside a plastic bag.
Independent Variables:
Temperature of Bouncy ball
Control Variables:
Drop height of ball, Mass and radius of the ball, The surface on which the ball is dropped
Dependent Variables:
COR: Ratio of the height of a ball after it bounces to the height of the ball before it bounces
2.) The relationship between basketball’s internal air pressure and its elasticity
Experimental Setup:
A motion sensor is used to detect the drop of the ball with varied pressures of the basketball
Independent Variables:
Air pressure inside the ball
Constant variables:
Temperature of the ball, volume of the ball, surface of the collision, type of the ball
Dependent Variables:
Height of the first bounce after the drop
3.) Effect of salinity on specific heat capacity
Experimental Setup:
To find the specific heat capacity of the water (saline), an experiment is set up using a spirit burner. This in turn will allow you to burn a necessary amount of ethanol to find the temperature change of said ethanol along with the enthalpy change of combustion of ethanol too.
Independent Variables:
Concentration of the salt in the solution
Constant Variables:
Initial mass of alcohol that is put in the spirit burner, Volume of water used, Distance between the burner and the calorimeter, Thickness of the calorimeter
Dependent Variables:
Specific heat capacity of the solution
4.) How does the density of water affect single slit diffraction patterns of waves?
Experimental Setup:
Set up an experiment accordingly. Pour a solution into the ripple tank container and turn on the ripple motor with a set frequency and lamp. Analyze the diffraction of the waves by measuring the wavelength and the diffraction angle.
Independent Variables:
Density of water solution
Constant Variables:
Frequency of wave, Temperature of solution
Dependent Variables:
Diffraction patterns
5.) How does the height and materials of a ramp affect the time taken for a cylinder to roll down the ramp? Investigating static friction coefficients?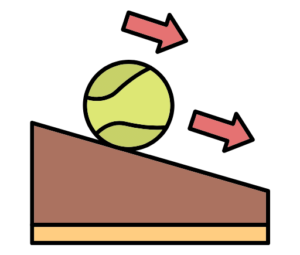
Experimental Setup:
A cylinder is rolled down a ramp of different heights first. Whichever height allows the cylinder to take the least time to reach the end of the ramp, that height is used as a constant for when the material of the surface of the ramp is varied.
Independent Variables:
Height of the ramp, materials of the surface of the ramp
Constant Variables:
‘Mass and dimensions of the cylinder, length of the ramp
Dependent Variables:
Static friction coefficient
6.) To find the temperature dependence of resonant frequency of a wine glass
Experimental Setup:
A wine glass is filled up with water and three temperature probing devices are used to measure surface temperature of the wine glass at three different spots. A sound is created by rotating your finger around the rim of the glass frequency of which is measured on a FFT graph on logger pro software using a microphone. The temperature of the liquid can be varied by either using ice or a water heater.
Independent Variables:
Temperature of water
Control Variables:
Material of glass, height of the fluid in the wine glass
Dependent Variables:
Frequency of the sound produced
7.) Variation of terminal velocity with height of release
Experimental Setup:
Drop a coffee filter from heights > 2m and measure its velocity in the last 10cm of fall using motion sensors or video or camera or manually using a stopwatch.
Independent Variables:
Height of drop
Constant variables:
Wind conditions, dimensions of the coffee filter
Dependent Variables:
Time taken for fall
8.) To find the specific energy of different material
Experimental Setup:
Collect different samples of flammable substances and burn them under supervised conditions. Use the heat produced to boil water.
Independent Variables:
Fuel type
Constant Variables:
Amount of fuel and water
Dependent Variables:
Temperature increase after a fixed time interval
9.) To calculate the spring constant by using conservation of energy
Experimental Setup:
Setup a smooth platform with vertical support to fix a spring. Take a small wooden box and compress the spring using it and when you leave it the box will fly off and initial velocity can measured using video camera or motion sensors
Independent Variables:
Compression of the spring
Constant Variables:
Mass of the box, spring type, smoothness of the surface
Dependent Variables:
Initial velocity of the box
10.) Effect of mass on falling object Investigating static friction coefficients
Experimental Setup:
Drop object of different masses from the same height and measure the time taken for the fall
Independent Variables:
Mass of the object
Constant Variables:
Height of drop
Dependent Variables:
Time taken for the fall
11.) To study the effect of the time period of a pendulum on the amplitude of oscillation
Experimental Setup:
Measure time period of oscillation of a pendulum at different amplitudes for small angles
Independent Variables:
Initial amplitude
Control Variables:
Length of the pendulum, mass of the bob
Dependent Variables:
Time period of oscillation
12.) Effect of distance at which force is applied on the bending of a cantilever beam
Experimental Setup:
Support a beam horizontally on a table with a portion of it suspended out of the table’s edge with no support below. Now hang a mass on the suspended end of the beam using a string at a different distance from the table edge and measure the deflection/bending of the beam.
Independent Variables:
Distance at which mass is suspended from the point of contact
Constant variables:
Mass placed, material of beam, suspended length of the beam, length of string attached to the mass
Dependent Variables:
Maximum deflection of the cantilever
13.) Change in density of a fluid with temperature
Experimental Setup:
Measure and study the variation of density of fluids with temperature(try honey, water and coffee)
Independent Variables:
Mass of the fluid and temperature
Constant Variables:
Method of heating
Dependent Variables:
Volume of the fluid
14.) Effect of headwind on a airplane model
Experimental Setup:
Fly a paper airplane and measure the variation of landing distance in presence of headwinds created by an electrical fan or manual winds of varying intensity.
Independent Variables:
Wind speeds and direction
Constant Variables:
Shape and size of the plane, launch speed
Dependent Variables:
Distance of flight
15.) To find the angle of maximum range in a projectile motion of a ball or a javelin throw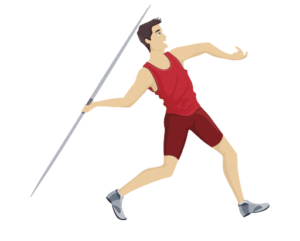
Experimental Setup:
Launch a ball or throw a javelin at multiple angles with the same velocity and measure the range covered at different angles preferably using a simulation.
Independent Variables:
Mass of the Angle of throw
Constant Variables:
Velocity of throw, wind conditions
Dependent Variables:
Range/horizontal distance covered
16.) To what extent does salinity affect the viscosity of water
Experimental Setup:
Taking various samples of water with different concentrations of salt and measuring the viscosity of the solution utilising capillary viscometers
Independent Variables:
Salt concentration of salt-water solution
Dependent Variables:
Viscosity of the solution
17.) To what extent does the impurity of a solution affect its specific heat capacity
Experimental Setup:
Changing the purity of a solution such as water and sugar and measuring the specific heat capacity of each solution and analysing the effect of this phenomena
Independent Variables:
Concentration of sugar
Dependent Variables:
Specific Heat Capacity
18.) How does temperature affect the conductivity of different materials such as metal, plastic, and glass?
Experimental Setup:
The experiment will consist of measuring the conductivity of different materials at different temperatures using a multimeter. The equation that will be used to calculate the conductivity is σ = 1/ρ. A graph will be plotted to show the relationship between temperature and conductivity for all three materials.
Independent Variables:
Temperature of the material
Dependent Variables:
Conductivity of the material
19.) How does the distance from a light source affect the intensity of the light?
Experimental Setup:
The experiment will consist of measuring the intensity of light from a light source at different distances using a light meter. A graph will be plotted to show the relationship between the distance and the intensity of the light. The equation that is used is I – P/4πr2
Independent Variables:
Distance from the light source
Dependent Variables:
Intensity of the light
20.) How does the type of material affect the reflection and refraction of light?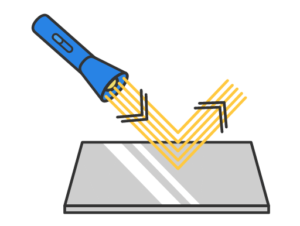
Experimental Setup:
The experiment will entail a light that shines onto different materials. Furthermore, the angle of reflection and refraction will be measured using a protractor. There will be a graph that will represent the relationship between the type of material and the angle of refraction and reflection. An equation that needs to be used during the course of this investigation is n1sinθ1 = n2sinθ2.
Independent Variables:
Type of the material that the light shines onto
Dependent Variables:
Angle of refraction and angle of reflection
21.) How does the shape of a sphere affect its drag coefficient in a fluid?
Experimental Setup:
The experiment revolves around measuring the drag force acting on the spheres of different shapes as they move through one specific fluid. All the spheres need to be released into the liquid in the same way. A graph will later be plotted to determine the relationship between the shape of the sphere and its drag coefficient. A formula needs to be used to calculate this coefficient.
Independent Variables:
Different shapes of the sphere (spherical, oblong and flat)
Dependent Variables:
Drag coefficient of each of the 3 spheres
22.)How does the temperature affect the viscosity of a fluid?
Experimental Setup:
For this experiment, the time taken for the fluid to flow through a viscometer for a fixed length will be measured. The viscosity of the fluid will be calculated using the time and the flow rate. A graph will be plotted to establish the relationship between the temperature of the fluid and the viscosity of the fluid.
Independent Variables:
Temperature of the fluid
Dependent Variables:
Viscosity of the fluid
23.) How does the volume of an object affect its density? Investigate using the Archimedes Principle.
Experimental Setup:
This experiment will consist of measuring the buoyant force acting on an object submerged in a fluid. The density of the object will be calculated using the buoyant force and the volume of the object. A graph will be drawn to depict the relationship between volume and density of the object.
Independent Variables:
Volume of the object
Dependent Variables:
Density of the object
24.) Investigating and measuring the speed of sound in a gas
Experimental Setup:
To do this experiment, the time taken for a sound wave to travel a fixed distance in a gas will be measured. The speed of the sound will be calculated using the time and distance and a graph will be drawn to showcase this relationship.
Independent Variables:
Temperature of the gas
Dependent Variables:
Speed of sound
25.) Investigating Snell’s Law for multiple refractions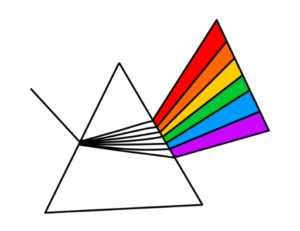
Experimental Setup:
The experiment will consist of shining a light beam through two media with different indices of refraction. The angle of incidence and the angle of refraction will be measured for each refraction. A graph will be plotted to show the relationship between the angle of incidence, the angle of refraction and the indices of refraction of the two media
Independent Variables:
The angle of incidence, the angle of refraction and the indices of refraction of the two media
Dependent Variables:
The angles of refraction and the final direction of the light beam


IBDP Study Notes

IB Comprehensive Syllabus

IB CAS Ideas