Modelling Rates of change: Exponential and logarithmic functions Notes
Rates of change are fundamental to understanding dynamic systems. In IBDP Mathematics, Applications and Interpretation (AI) courses utilize exponential and logarithmic functions to model these changes. This study note explores these functions, their properties, graphs, and real-world applications. Mastering these concepts is crucial for the IB Mathematics syllabus, regardless of your chosen course.
By the end of this chapter you should be familiar with:
- Uncertainty and random behaviour
- Trial, outcome, equally likely outcomes and relative frequency
- Sample space and event
- Theoretical probability
- Venn diagrams, tree diagrams, sample space diagrams and tables of outcome
- Compound events
- Exclusive, dependent and independent events
CONCEPTS AND DEFINITIONS
Experiment: A process by which you obtain an observation.
Trials: Repeating an experiment a number of times.
Outcome: A possible result of an experiment.
Event: An outcome or set of outcomes.
Sample space: The set of all possible outcomes of an experiment, always denoted by U.
If we have an event A and n trials then: Relative frequency of A = (𝐹𝑟𝑒𝑞𝑢𝑒𝑛𝑐𝑦 𝑜𝑓 𝑜𝑐𝑐𝑢𝑟𝑒𝑛𝑐𝑒 𝑜𝑓 𝑒𝑣𝑒𝑛𝑡 𝐴 𝑖𝑛 𝑛 𝑡𝑟𝑖𝑎𝑙𝑠) /𝑛
This is known as experimental probability of the event A.
The formula for theoretical probability P(A) of an event A is: P(A) =𝑛(𝐴)/𝑛(𝑈) where n(A) is the number of outcomes that make A happen and n(U) is the total number of outcomes.
Probability values can only be between 0 and 1 i.e., 0 ≤P(A) ≤ 1.
- The probability of something which is certain to happen is 1.
- The probability of something which is impossible to happen is 0.
- The probability of something not happening is 1 minus the probability that it will happen i.e., P(A) = 1 – P(A’) where A’ represents the complement of A
- Two events are said to be mutually exclusive if they have nothing in common i.e., P(A or B) = P(A) + P(B), this is the addition rule of mutually exclusive events.
Example: What is the probability of rolling a 4 with a die.
Solution: Number of ways it can happen: 1 (there is only 1 face with a “4” on it)
Total number of outcomes: 6 (there are 6 faces altogether)
So, the probability = 1/6
Example: There are 5 marbles in a bag: 4 are blue, and 1 is red. What is the probability that a blue marble gets picked?
Solution: Number of ways it can happen: 4 (there are 4 blues)
Total number of outcomes: 5 (there are 5 marbles in total)
So, the probability = 4/5 = 0.8
REPRESENTING THE SAMPLE SPACE
VENN DIAGRAMS
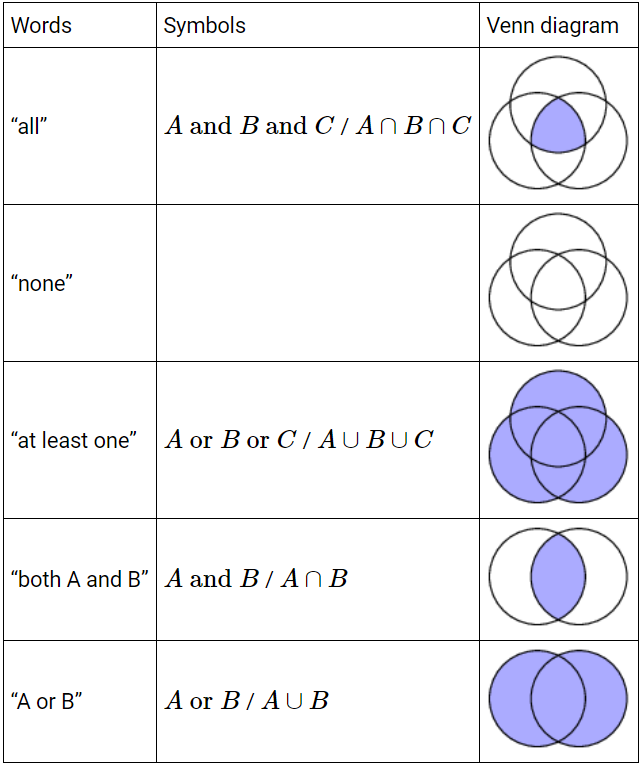
A venn diagram represents mathematical or logical sets pictorially as circles or closed curves within an enclosing rectangle (the universal set), common elements of the sets being represented by intersections of the circles.
If we have two events A, B:
- If both the events A and B occur then we can write it as A B
- If the event A or B or both occur then we can write it as A B
- P(A U B) = P(A) + P(B) – P(A ∩ B)
If two events are mutually exclusive then P(A ∩ B) = 0
P(A U B) = P(A) + P(B)
The following table shows how to represent them in the form of a venn diagram:
Example: Draw a Venn diagram that shows the following sample space and events:
- S: all the integers from 1 to 30
- P: prime numbers
- M: multiples of 3
- F: factors of 30
Solution: The sample space contains all the positive integers up to 30 S = {1, 2, 3,…,30}
The prime numbers between 1 and 30 are P = {2, 3, 5, 7, 11, 13, 17, 19, 23, 29}
The multiples of 3 between 1 and 30 are M = {3, 6, 9, 12, 15, 18, 21, 24, 27, 30}
The factors of 30 are F = {1, 2, 3, 5, 6, 10, 15, 30}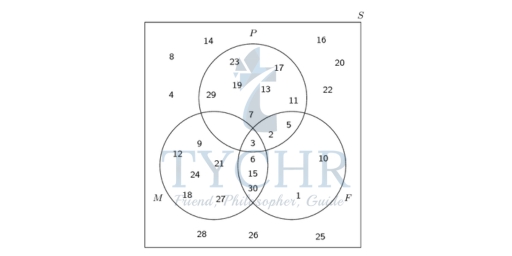
TREE DIAGRAMS
To solve problems involving independent events, it is often helpful to draw a tree diagram.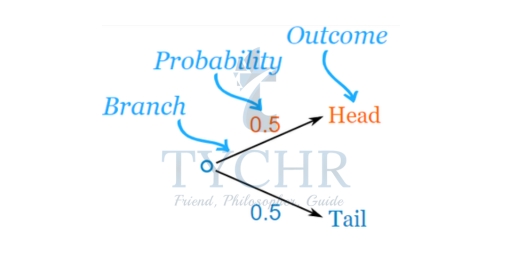
Here is a tree diagram for the toss of a coin:
Here are two “branches” (Heads and Tails)
The probability of each branch is written on the branch and the outcome is written at the end of the branch.
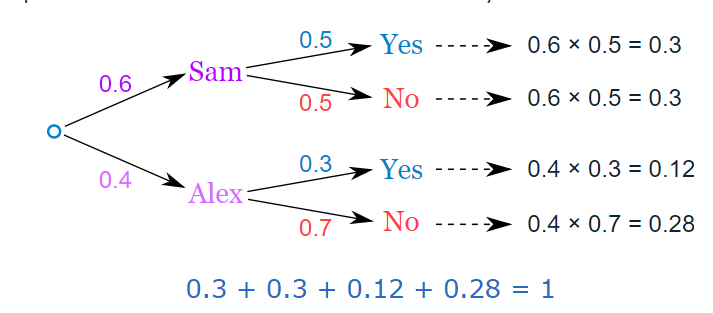
We multiply probabilities along the branches and we can also add probabilities down columns.
Example: You are off to soccer, and love being the Goalkeeper, but that depends who is the Coach today: With Coach Sam the probability of being Goalkeeper is 0.5 and with Coach Alex the probability of being Goalkeeper is 0.3. Sam is Coach more often, about 6 out of every 10 games. So, what is the probability you will be a Goalkeeper today?
Solution:
SAMPLE SPACE DIAGRAMS
Sample space is a term used in mathematics to mean all possible outcomes. For example, the sample space for rolling a normal dice is {1,2,3,4,5,6} as these are all the only outcomes we can obtain.
The sample space for flipping a coin is {H, T}.
What if we wanted to know the possible outcomes for flipping a coin and rolling a dice? The sample space for these two combined events is {H1, H2, H3, H4, H5, H6, T1, T2, T3, T4, T5, T6}.
We could also write out the sample space for rolling two dice, but to simplify things mathematicians often use sample space diagrams.
Look at this sample space diagram for rolling two dice:
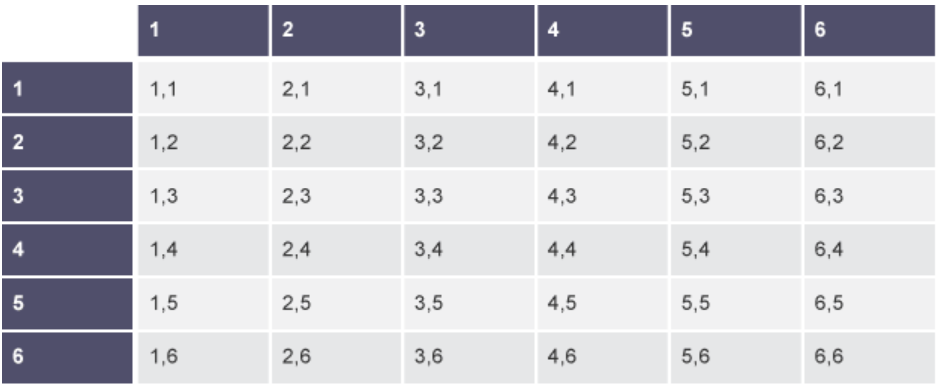
From the diagram, we can see that there are 36 possible outcomes. The probability of getting the outcome 3,2 is 1/36 because 3,2 only appears once in the sample space diagram and there are 36 outcomes in total.
The probability of getting a 3 and a 2 is 2/36 = 1/18. This is because to get a 3 and a 2 we can have either the outcome 3,2 or the outcome 2,3.
CONDITIONAL PROBABILITY
The conditional probability (which is basically Bayes’ theorem) of an event B is the probability that the event will occur given the knowledge that an event A has already occurred. This probability is written P(B|A), notation for the probability of B given A. In the case where events A and B are independent (where event A has no effect on the probability of event B), the conditional probability of event B given event A is simply the probability of event B, that is P(B).
If events A and B are not independent, then the probability of the intersection of A and B (the probability that both events occur) is defined by
P(A and B) = P(A)P(B|A).
From this definition, the conditional probability P(B|A) is easily obtained by dividing by P(A): P(B|A) = 𝑷(𝑨∩𝑩) /𝑷(𝑨)
For independent events,
P(A∩B) = P(B|A) P(A) = P(A) P(B)
Example: A box contains 14 dark and 6 milk chocolates. Sarah randomly selects three chocolates to eat. Find the probability that Sarah selects:
- At least one milk chocolate.
- Three milk chocolates given that she selects at least one milk chocolate.
Solution:
- P(at least one milk chocolate) = 1 – ( 14/20 )( 13/19 )( 12 /18 ) = 194/285
- P(3 milk | at least one milk) = ((6/20)(5/19)(4/18))/ (194 /285) = 5/194
Exponential and logarithmic functions are powerful tools for modeling rates of change. This study note has covered the essential concepts. Practice is crucial for mastering these functions. For personalized support in IB Math HL or SL, consider working with a tutor. TYCHR connects students with experienced IB Math AI HL & SL tutors who can provide tailored assistance. A strong foundation in these functions will help you succeed in IB DP Mathematics.

