
SECTION: A
1.) A reliable method of estimating cardiovascular fitness is by measuring the body’s oxygen consumption when the rate of heartbeat is at its maximum (Vmax) during intense exercise. This test was used to measure fitness among 71 volunteers. Two weeks later, the same individuals were asked to run for 2.1 km at two different speeds (V70 and V90) and the power they developed during these runs was measured.
• V70 in which they ran at a speed where their rate of the heartbeat was 70% Vmax.
• V90 in which they ran at a speed where their rate of the heartbeat was 90% Vmax.
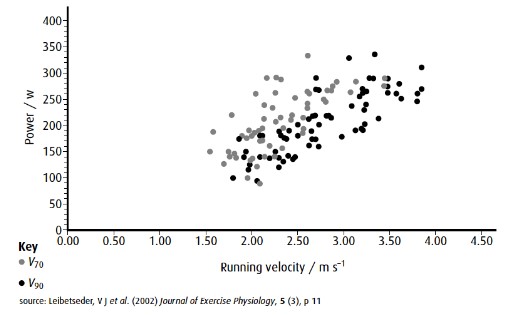
A. State the maximum power developed by a runner at V70.
335 (±5) W
B. Outline the relationship between running velocity and power developed at V90.
As velocity increases, power increases
C. Compare the data for V70 and V90.
Both have the same/similar maximum power. Both show increased power at greater velocities.
D. Suggest why measurements of Vmax are dangerous for older people.
Risk of heart attack
2.) An experiment was conducted to investigate the effect of pH on the activity of the enzyme amylase. Amylase is an enzyme that catalyzes the hydrolysis of starch into maltose.
The experiment was set up as follows:
- A solution of starch was prepared and divided equally into five test tubes.
- A solution of amylase was also prepared and divided equally into five test tubes.
- Each test tube containing amylase was assigned a different pH value (3, 5, 7, 9, and 11).
- Each test tube containing starch was then mixed with its corresponding amylase test tube.
- The mixture was allowed to react for 5 minutes at room temperature.
- The reaction was stopped by adding iodine solution.
pH | Time taken for complete hydrolysis (min) |
3 | 50 |
5 | 20 |
7 | 10 |
9 | 25 |
11 | 45 |
a) (i) Which pH value had the fastest rate of amylase activity?
The pH value of 7 had the fastest rate of amylase activity.
(ii) Which pH value had the slowest rate of amylase activity?
The pH value of 3 had the slowest rate of amylase activity.
(iii) Why might the rate of amylase activity be affected by changes in pH?
Changes in pH can affect the ionization state of the amino acid residues that make up the active site of the enzyme. This can alter the shape of the active site and its ability to interact with the substrate, leading to changes in enzyme activity.
b) Based on the results, what can you conclude about the effect of pH on the activity of amylase?
The results indicate that amylase activity is highest at a pH of 7 and decreases as the pH becomes more acidic or alkaline.
c) How might these results be useful in a real-world context?
These results may be useful in industries that use amylase, such as food and textile manufacturing, where pH conditions can be optimized to maximize enzyme activity and efficiency.
3.) The table below shows the blood pressure readings of a patient measured at three different points along the circulatory system.
Blood vessel | Systolic pressure (mmHg) | Diastolic pressure (mmHg) |
Artery A | 140 | 90 |
Arteriole B | 120 | 80 |
Capillary C | 40 | 20 |
a) Explain the difference in systolic and diastolic pressure between Artery A and Capillary C.
The difference in systolic and diastolic pressure between Artery A and Capillary C is due to the loss of pressure as blood moves through the circulatory system. Arteries have thick walls and are able to withstand the high pressure of the blood as it is pumped from the heart. Capillaries, on the other hand, have thin walls and are unable to withstand the high pressure. This results in a drop in pressure as blood moves from the arteries to the capillaries. Additionally, capillaries are the site of gas and nutrient exchange, so the lower pressure allows for more efficient exchange to occur.
b) Discuss the significance of the pressure drop between Artery A and Arteriole B.
The pressure drop between Artery A and Arteriole B is significant because it represents the resistance of the arterioles. Arterioles are able to constrict or dilate, which allows them to regulate blood flow to different tissues and organs. The drop in pressure is due to the increased resistance of the arterioles, which is necessary for proper regulation of blood flow.
c) Analyze the possible implications of the low diastolic pressure in Capillary C.
The low diastolic pressure in Capillary C may indicate poor perfusion of the tissues. Diastolic pressure represents the pressure in the blood vessels during the relaxation phase of the heart cycle. If the diastolic pressure is too low, it may indicate that there is not enough blood flow to the tissues. This can lead to tissue damage or even organ failure. Additionally, low diastolic pressure may be a symptom of hypotension, which can lead to dizziness, fainting, and other health problems.
SECTION: B
Answer all of the questions from one of the options.
Option A: Neurobiology and Behaviour
1.) Sarah is a 25-year-old woman who has been experiencing frequent seizures for the past year. She has been diagnosed with epilepsy and is currently being treated with medication. Despite the treatment, she still experiences seizures every few weeks, which affects her daily life.
a) Define epilepsy and describe the neural mechanisms involved in seizure activity.
Epilepsy is a neurological disorder characterized by recurrent seizures. Seizure activity is caused by abnormal electrical activity in the brain, which can disrupt normal brain function. The neural mechanisms involved in seizure activity involve the synchronization and hyperexcitability of groups of neurons in the brain, leading to the propagation of abnormal electrical signals.
b) Analyze the impact of epilepsy on Sarah’s daily life and mental health.
Epilepsy can have a significant impact on Sarah’s daily life and mental health. Frequent seizures can interfere with her ability to work, drive, and engage in social activities. The unpredictability of seizures can also lead to anxiety and depression, which can further affect her quality of life.
c) Evaluate the effectiveness of different treatment options for epilepsy, including medication and surgery.
There are various treatment options for epilepsy, including medication and surgery. Anti-epileptic medications can help control seizures by reducing the hyperexcitability of neurons in the brain. However, not all patients respond well to medication, and some may experience side effects. Surgery, such as temporal lobectomy, can be an effective option for patients with intractable epilepsy, but it carries risks and can lead to cognitive deficits.
d) Discuss the ethical implications of using deep brain stimulation (DBS) as a treatment for epilepsy, with reference to research studies.
Deep brain stimulation (DBS) is a promising treatment option for epilepsy, but it raises ethical implications. DBS involves the implantation of electrodes in the brain to deliver electrical stimulation to specific regions that are involved in seizure activity. While DBS can be effective in reducing seizures, it also raises concerns about the invasiveness of the procedure, the potential risks and side effects, and the long-term effects of brain stimulation. Research studies have shown that DBS can improve seizure control and quality of life in some patients, but more research is needed to fully understand its efficacy and ethical implications.
2.) The table below shows the results of an experiment investigating the effects of caffeine on the reaction times of participants.
Participant | Reaction Time (ms) | Reaction Time with Caffeine (ms) |
1 | 550 | 500 |
2 | 600 | 570 |
3 | 525 | 490 |
4 | 480 | 460 |
5 | 580 | 530 |
a) Calculate the mean reaction time for each condition.
Mean reaction time without caffeine = (550+600+525+480+580)/5 = 547 ms
Mean reaction time with caffeine = (500+570+490+460+530)/5 = 510 ms
b) Using the mean values, calculate the percentage change in reaction time with caffeine for each participant.
Percentage change in reaction time with caffeine for each participant:
Participant 1: ((550-500)/550) x 100 = 9.09%
Participant 2: ((600-570)/600) x 100 = 5%
Participant 3: ((525-490)/525) x 100 = 6.67%
Participant 4: ((480-460)/480) x 100 = 4.17%
Participant 5: ((580-530)/580) x 100 = 8.62%
c) Discuss the possible mechanisms by which caffeine may affect reaction time.
Possible mechanisms by which caffeine may affect reaction time include:
- Caffeine blocks the action of adenosine, a neurotransmitter that promotes sleep and suppresses arousal. By blocking adenosine, caffeine may increase alertness and arousal, leading to faster reaction times.
- Caffeine stimulates the release of adrenaline, a hormone that can increase heart rate and blood pressure. This increased physiological arousal may also contribute to faster reaction times.
3.) The table below shows the results of an experiment investigating the effects of temperature on the heart rate of goldfish.
Temperature (°C) | Heart Rate (beats/min) |
15 | 60 |
20 | 90 |
25 | 120 |
30 | 140 |
35 | 160 |
a) Plot a graph of heart rate against temperature.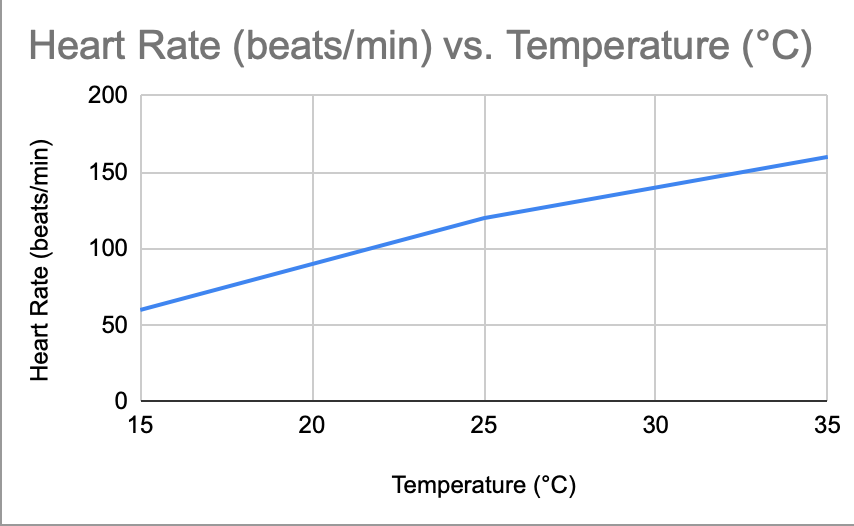
b) Describe the relationship between temperature and heart rate.
The relationship between temperature and heart rate appears to be positive and linear. As temperature increases, heart rate also increases.
c) Discuss the potential limitations of using goldfish as a model for human cardiac physiology.
- Goldfish hearts have two chambers, whereas human hearts have four chambers. This means that the mechanisms of cardiac function may be different between the two species.
- The size and shape of the heart may be different between goldfish and humans, which may affect the way that they respond to changes in temperature.
- Goldfish are ectothermic, meaning that their body temperature is regulated by the environment rather than by internal physiological mechanisms. This may make their response to changes in temperature different from that of endothermic animals like humans.
4.) The table below shows the results of an experiment investigating the effects of a drug on the swimming behaviour of tadpoles.
Tadpole | Number of Swims without Drug | Number of Swims with Drug |
1 | 20 | 5 |
2 | 30 | 15 |
3 | 10 | 2 |
4 | 15 | 8 |
5 | 25 | 12 |
a) Calculate the percentage change in the number of swims with the drug compared to without the drug for each tadpole.
Percentage change in the number of swims with the drug compared to without the drug for each tadpole:
Tadpole 1: ((20-5)/20) x 100 = 75%
Tadpole 2: ((30-15)/30) x 100 = 50%
Tadpole 3: ((10-2)/10) x 100 = 80%
Tadpole 4: ((15-8)/15) x 100 = 46.67%
Tadpole 5: ((25-12)/25) x 100 = 52%
b) Calculate the mean percentage change across all tadpoles.
Mean percentage change across all tadpoles = (75+50+80+46.67+52)/5 = 60.33%
c) Discuss the potential applications of this research in the field of neuroscience.
- Understanding the effects of drugs on behavior can help researchers to develop treatments for disorders that affect behavior, such as ADHD and addiction.
- Studying the effects of drugs on tadpoles can provide insights into the mechanisms by which these drugs affect the brain and behavior.
- By studying the effects of drugs on simple organisms like tadpoles, researchers can develop a better understanding of how these drugs may affect more complex organisms like humans.
5.) Describe the structure and function of the neuron, and explain how neurons communicate with each other at synapses.
A neuron is a specialized cell that is responsible for transmitting information throughout the nervous system. It has three main parts: the cell body, dendrites, and axon. The cell body contains the nucleus and other organelles, and is responsible for maintaining the health of the neuron. Dendrites are branching extensions of the cell body that receive signals from other neurons. The axon is a long, thin extension of the cell body that transmits signals to other neurons or to muscles or glands.
When a neuron is stimulated, it generates an electrical signal called an action potential that travels down the axon. At the end of the axon, the neuron forms a synapse with another neuron or with a muscle or gland. The synapse is a tiny gap between the two cells. When the action potential reaches the end of the axon, it triggers the release of neurotransmitters, which are chemicals that carry signals across the synapse. The neurotransmitters bind to receptors on the receiving cell, which can either excite or inhibit the activity of that cell. This process of neurotransmitter release and reception is how neurons communicate with each other at synapses.
Option B: Biotechnology and Bioinformatics
6.) CRISPR-Cas9 is a revolutionary gene-editing technology that allows precise and efficient modification of DNA in living organisms. However, there are ethical concerns about its use in humans.
a) Describe the CRISPR-Cas9 system and how it works.
The CRISPR-Cas9 system is a powerful gene editing tool that uses a combination of RNA and enzymes to precisely cut DNA sequences. The RNA molecule is designed to match a specific DNA sequence, and the Cas9 enzyme then cuts the DNA at that location. Once the DNA is cut, it can be edited or modified in various ways.
b) Explain how CRISPR-Cas9 can be used to treat genetic diseases.
CRISPR-Cas9 has the potential to treat genetic diseases by editing the DNA of affected cells. For example, it could be used to replace a faulty gene with a functional one, or to disable a gene that is causing a disease. This approach could provide a cure for diseases that are currently untreatable.
c) Discuss the ethical concerns surrounding the use of CRISPR-Cas9 in humans.
There are several ethical concerns surrounding the use of CRISPR-Cas9 in humans. One concern is the potential for unintended consequences, such as off-target effects that could cause unintended mutations. Another concern is the possibility of germline editing, which would result in heritable changes to future generations. There are also concerns about the equity of access to the technology and the potential for creating “designer babies” with enhanced traits.
d) Evaluate the potential benefits and risks of using CRISPR-Cas9 in agriculture.
The use of CRISPR-Cas9 in agriculture has the potential to increase crop yields, enhance disease resistance, and reduce the need for pesticides. However, there are also risks associated with this technology. For example, the unintended consequences of editing the genomes of crops could have unforeseen effects on the environment and human health. Additionally, the use of CRISPR-Cas9 in agriculture could exacerbate existing inequalities in the food system if it is only available to large-scale farmers. It is important to carefully consider both the benefits and risks of using CRISPR-Cas9 in agriculture.
7.) A researcher is analyzing the DNA of a sample of bacteria using gel electrophoresis. The results of the analysis are shown in the table below:
Lane | Distance Moved (cm) |
1 | 2.4 |
2 | 2.1 |
3 | 1.8 |
4 | 1.5 |
a) Identify the lane that represents the largest fragment of DNA.
Lane 1 represents the largest fragment of DNA.
b) Explain how gel electrophoresis separates DNA fragments based on their size.
Gel electrophoresis separates DNA fragments based on their size because the gel matrix has small pores that allow smaller fragments of DNA to move through more quickly than larger fragments. When an electric current is applied, the DNA fragments move through the gel towards the positive electrode, with smaller fragments moving further and faster than larger fragments.
c) Suggest one application of gel electrophoresis in the field of biotechnology.
One application of gel electrophoresis in the field of biotechnology is in DNA fingerprinting, which can be used to identify individuals by their unique DNA profiles.
8.) A group of researchers are using bioinformatics to study a gene that is associated with a particular disease. They have identified a single nucleotide polymorphism (SNP) in the gene that is more common in individuals with the disease than in the general population. The results of their analysis are shown in the table below:
Genotype | Number of Individuals with Disease | Number of Individuals without Disease |
CC | 10 | 20 |
CT | 25 | 40 |
TT | 15 | 10 |
a) Calculate the frequency of the C allele in the population of individuals with the disease.
The frequency of the C allele in the population of individuals with the disease is (10 x 2 + 25) / (10 x 2 + 25 + 15 x 2) = 0.5.
b) Calculate the odds ratio for the SNP.
The odds ratio for the SNP is (10/20) / (15/10) = 0.67.
c) Interpret the odds ratio in terms of the risk of developing the disease.
An odds ratio of 0.67 suggests that individuals with the C allele are less likely to develop the disease than individuals with the T allele. Specifically, individuals with the C allele have odds of developing the disease that are 0.67 times the odds of individuals with the T allele.
9.) The diagram below shows the process of recombinant DNA technology.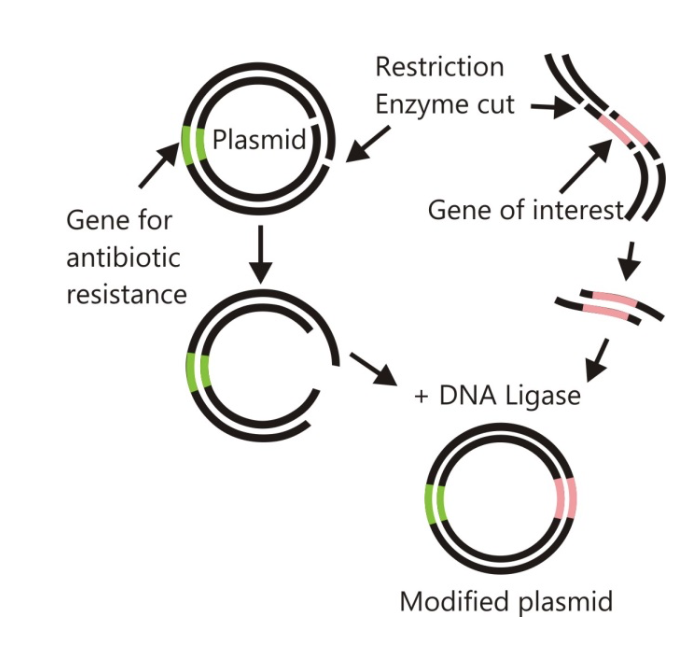
a) Label the following on the diagram:
i. the restriction enzyme
ii. the vector DNA
iii. the ligase enzyme
b) Explain the role of the restriction enzyme and the ligase enzyme in the process of recombinant DNA technology.
The restriction enzyme cuts the DNA at specific sequences, called restriction sites. This creates fragments of DNA with sticky ends. The sticky ends are complementary and can be joined to another piece of DNA with the same sticky ends. This is where the vector DNA comes in. It is a small, circular piece of DNA that can be used to carry the desired gene into the host cell. The vector DNA is cut with the same restriction enzyme, creating sticky ends that can bind to the sticky ends of the DNA fragment. The ligase enzyme is then used to join the two pieces of DNA together, creating a recombinant DNA molecule.
c) Outline the potential benefits and risks associated with the use of genetically modified organisms (GMOs) in agriculture.
Potential benefits of using genetically modified organisms in agriculture include:
- Increased crop yield and productivity
- Reduced need for pesticides and herbicides
- Increased nutrient content in crops
- Increased resistance to environmental stresses such as drought or extreme temperatures
Potential risks associated with using genetically modified organisms in agriculture include: - Potential harm to non-target organisms, such as beneficial insects or animals that feed on the modified crops
- The possibility of the modified genes spreading to wild populations
- The potential for unintended consequences, such as the development of new plant pathogens or pests
- The potential for reduced genetic diversity in crops, which could make them more vulnerable to disease or environmental stresses in the long term.
10.) Explain the process of PCR (polymerase chain reaction) and its applications in biotechnology.
PCR (polymerase chain reaction) is a laboratory technique used to amplify a specific segment of DNA. It involves three basic steps: denaturation, annealing, and extension.
During the denaturation step, the double-stranded DNA molecule is heated to a high temperature, causing the two strands to separate and become single-stranded. During the annealing step, short, single-stranded pieces of DNA called primers are added to the mixture. The primers are designed to bind to specific regions of the single-stranded DNA template. During the extension step, a heat-stable DNA polymerase enzyme, such as Taq polymerase, synthesizes a new complementary strand of DNA starting from the primers.
This cycle of denaturation, annealing, and extension is repeated multiple times, resulting in an exponential increase in the number of copies of the target DNA segment.
PCR has a wide range of applications in biotechnology, including genetic research, medical diagnostics, and forensic analysis. It can be used to amplify DNA samples from a wide range of sources, including blood, hair, and tissue samples. PCR can also be used to detect the presence of pathogens, such as viruses or bacteria, in clinical samples. Additionally, it can be used to create DNA libraries, which are collections of DNA fragments that can be sequenced and analyzed to better understand the genetic basis of various traits or diseases.
Option C: Ecology and Conservation
11.) A group of scientists is conducting a study on the conservation of a population of endangered sea turtles that inhabit a coastal area in the Pacific. They have observed a decline in the number of nesting females and hatchlings in recent years, and suspect that human activities and climate change may be contributing to the decline.
a) Define biodiversity and explain why sea turtles are an important component of marine biodiversity.
Biodiversity refers to the variety of life on Earth, including all living organisms and their interactions with each other and their environment. Sea turtles are an important component of marine biodiversity, as they play a key role in maintaining the health of marine ecosystems. They help control the population of jellyfish and other invertebrates, and their eggs and hatchlings provide important nutrients for other species.
b) Analyze the impact of human activities, such as fishing and beach development, on sea turtle populations.
Human activities can have a significant impact on sea turtle populations. Fishing can lead to accidental bycatch of sea turtles, which can result in injury or death. Beach development, such as construction of hotels and other infrastructure, can destroy or disrupt nesting sites, which can affect the reproductive success of sea turtles.
c) Evaluate the effectiveness of conservation measures, such as protected areas and fishing regulations, in mitigating the threats to sea turtles.
There are various conservation measures that can help mitigate the threats to sea turtles. Protected areas, such as marine reserves and nesting beaches, can help reduce the impact of human activities on sea turtles. Fishing regulations, such as gear restrictions and turtle excluder devices, can help reduce bycatch and improve the survival of sea turtles. Community-based conservation programs, such as education and awareness campaigns, can also help promote sustainable practices and reduce the demand for sea turtle products.
d) Discuss the role of climate change in the decline of sea turtle populations, with reference to research studies.
Climate change is another factor that can contribute to the decline of sea turtle populations. Rising sea levels and changes in ocean currents can affect the distribution and abundance of sea turtle habitats, and changes in temperature can affect the sex ratio of hatchlings. Research studies have shown that warming temperatures can lead to more female hatchlings, which can affect the genetic diversity and survival of sea turtle populations. Climate change can also lead to more frequent and severe storms, which can destroy nesting sites and reduce the reproductive success of sea turtles.
12. The table below shows the number of individuals of three different plant species found in three different habitats.
Habitat 1 |
Habitat 2 |
Habitat 3 |
|
Species 1 |
10 |
15 |
5 |
Species 2 |
5 |
20 |
30 |
Species 3 |
25 |
10 |
10 |
a) Calculate the total number of individuals for each plant species across all three habitats.
To calculate the total number of individuals for each plant species across all three habitats, we need to sum up the values for each species in each habitat.
Species 1: 10 + 15 + 5 = 30
Species 2: 5 + 20 + 30 = 55
Species 3: 25 + 10 + 10 = 45
b) Which species appears to be the most adapted to Habitat 2? Justify your answer.
To determine which species appears to be the most adapted to Habitat 2, we need to compare the values of each species in Habitat 2 with those in the other habitats. Species 2 has the highest value in Habitat 2 (20), compared to 5 and 30 for Habitats 1 and 3, respectively. Therefore, Species 2 appears to be the most adapted to Habitat 2.
c) Discuss one potential limitation of using plant population data to make conclusions about ecosystem health.
One potential limitation of using plant population data to make conclusions about ecosystem health is that it does not provide information about other important components of the ecosystem, such as the abundance and diversity of other organisms, nutrient cycling, and ecosystem services. A single measure of plant population data may not be sufficient to provide a comprehensive assessment of ecosystem health.
13.) The table below shows the population size and population growth rate for a population of deer over four years.
Year |
Population Size |
Population Growth Rate |
|
1 |
50 |
0.1 |
|
2 |
65 |
0.15 |
|
3 |
80 |
0.2 |
|
4 |
100 |
0.25 |
a) Calculate the change in population size from year 1 to year 4.
To calculate the change in population size from year 1 to year 4, we subtract the population size in year 1 from the population size in year 4.
Change in population size = Population size in year 4 – Population size in year 1
= 100 – 50
= 50
b) Calculate the average population growth rate over the four-year period.
To calculate the average population growth rate over the four-year period, we need to add up the growth rates for each year and divide by the number of years.
Average population growth rate = (0.1 + 0.15 + 0.2 + 0.25) / 4
= 0.175 or 17.5%
c) Explain one potential reason for a decrease in population growth rate over time.
One potential reason for a decrease in population growth rate over time is resource limitation. As a population grows, it may exhaust the resources available in its environment, such as food, water, and shelter. As resources become scarcer, the population growth rate may slow down or even decline, leading to a decrease in population size.
14.) The table below shows the population density and species richness of two different forest communities.
Forest A |
Forest B |
|
Population Density |
20 |
10 |
Species Richness |
12 |
8 |
a) Calculate the total number of individuals in each forest community.
To calculate the total number of individuals in each forest community, we need to multiply the population density by the species richness.
Forest A: 20 x 12 = 240
Forest B: 10 x 8 = 80
b) Which forest community has a higher species density? Justify your answer.
To determine which forest community has a higher species density, we need to divide the total number of individuals by the area of the forest community. However, the table does not provide information about the area of each forest community, so we cannot make a valid comparison.
c) Discuss one potential limitation of using species richness as a measure of biodiversity.
One potential limitation of using species richness as a measure of biodiversity is that it does not take into account the relative abundance of different species. A community with a high species richness but low abundance may be less diverse than a community with a lower species richness but higher abundance. To obtain a more comprehensive measure of biodiversity, other factors such as evenness and functional diversity should also be considered.
15.) Explain the concept of carrying capacity in population ecology and how it relates to conservation efforts.
Carrying capacity is the maximum number of individuals that a particular environment can support over a sustained period of time. It is determined by a variety of factors, including the availability of resources such as food, water, and shelter, as well as predation, disease, and competition for resources. When a population exceeds its carrying capacity, it can lead to a decline in resources, increased competition, and other negative impacts that can limit the population’s growth or even cause it to decline.
Carrying capacity is an important concept in population ecology and conservation efforts because it can help scientists and policymakers understand how human activities and environmental changes can affect populations of species. By monitoring population size and other factors that affect carrying capacity, conservationists can work to manage populations and ecosystems in a way that maintains biodiversity and ecosystem health.
For example, conservation efforts may involve habitat restoration, population management strategies such as selective culling or relocation, or the introduction of new food sources or other resources to support the growth of populations. By carefully monitoring populations and their environments, conservationists can work to ensure that populations remain within their carrying capacity, which can help to prevent declines in biodiversity and maintain healthy ecosystems.
Option D: Human Physiology
16.) Tom is a 45-year-old man who has been experiencing chronic stress at work for several months. He has noticed that he has trouble falling asleep, wakes up frequently during the night, and feels tired during the day. He also experiences muscle tension, headaches, and irritability.
a) Define the concept of stress and explain the physiological mechanisms involved in the stress response.
Stress is a psychological and physiological response to perceived threats or challenges. The stress response involves the activation of the hypothalamic-pituitary-adrenal (HPA) axis and the sympathetic nervous system. The HPA axis triggers the release of cortisol and other stress hormones, which can affect various physiological systems, including the cardiovascular, immune, and nervous systems.
b) Analyze the impact of chronic stress on Tom’s sleep and overall health.
Chronic stress can have a significant impact on Tom’s sleep and overall health. The constant activation of the stress response can interfere with the normal sleep-wake cycle, leading to insomnia and daytime fatigue. Chronic stress can also lead to physical and mental health problems, such as high blood pressure, diabetes, depression, and anxiety.
c) Evaluate the effectiveness of different stress management techniques in improving Tom’s symptoms.
There are various stress management techniques that can help improve Tom’s symptoms, such as cognitive-behavioural therapy, relaxation techniques, and exercise. Cognitive-behavioural therapy can help Tom identify and change negative thought patterns that contribute to stress. Relaxation techniques, such as deep breathing, progressive muscle relaxation, and meditation, can help reduce muscle tension and promote relaxation. Exercise can help release endorphins, which are natural stress-fighting hormones.
d) Discuss the role of social support in moderating the effects of stress on health, with reference to research studies.
Social support can play a significant role in moderating the effects of stress on health. Research has shown that social support can buffer the negative effects of stress on mental and physical health. For example, having supportive relationships can lower the risk of developing depression and anxiety in response to stress. Social support can also improve immune function and cardiovascular health. Tom may benefit from seeking support from friends, family, or a support group.
17.) The table below shows the oxygen dissociation curve for hemoglobin at different pH levels.
pH% |
Saturation |
|
7.6 |
35 |
|
7.4 |
50 |
|
7.2 |
70 |
|
7.0 |
85 |
a) Describe the relationship between pH and haemoglobin saturation.
The relationship between pH and haemoglobin saturation is inverse. As pH decreases, haemoglobin saturation increases.
b) Explain why the oxygen dissociation curve shifts to the right at lower pH levels.
The oxygen dissociation curve shifts to the right at lower pH levels because of the Bohr effect. This effect occurs when increasing levels of CO2 and H+ ions cause haemoglobin to release more oxygen molecules to the surrounding tissues.
c) How might the oxygen dissociation curve be affected in individuals with chronic obstructive pulmonary disease (COPD)?
In individuals with COPD, the oxygen dissociation curve may shift to the right due to decreased lung function and an increase in CO2 levels.
18.) The table below shows the results of a study investigating the effect of caffeine on heart rate.
Subject |
Heart Rate (BPM) at Baseline |
Heart Rate (BPM) after Caffeine |
|
1 |
70 |
80 |
|
2 |
80 |
90 |
|
3 |
60 |
70 |
|
4 |
90 |
1000 |
a) Calculate the mean increase in heart rate after caffeine consumption.
The mean increase in heart rate after caffeine consumption is 10 BPM.
b) Calculate the standard deviation of the heart rate measurements after caffeine consumption.
The standard deviation of the heart rate measurements after caffeine consumption is 9.79 BPM.
c) Explain one potential limitation of using heart rate as a measure of the physiological effects of caffeine.
One potential limitation of using heart rate as a measure of the physiological effects of caffeine is that other factors, such as stress or physical activity, can also affect heart rate.
19.) The table below shows the results of a study investigating the effects of exercise on blood glucose levels.
Time |
Blood Glucose Level (mmol/L) |
|
15 |
6.2 |
|
30 |
7.0 |
|
45 |
7.5 |
|
60 |
8.0 |
a) Calculate the change in blood glucose level from baseline to 60 minutes after exercise.
The change in blood glucose level from baseline to 60 minutes after exercise is 2.5 mmol/L.
b) Calculate the rate of change in blood glucose level per minute during the first 15 minutes after exercise.
The rate of change in blood glucose level per minute during the first 15 minutes after exercise is 0.13 mmol/L/min.
c) Explain one potential reason why blood glucose levels may continue to increase even after exercise has ended.
Blood glucose levels may continue to increase after exercise has ended because exercise can cause the release of glucose from the liver and muscles, which can continue to be metabolized even after the exercise has stopped.
20.) Outline how the oxygen debt is formed and repaid.
During exercise, the body requires more energy to perform muscular work. This energy is produced by the breakdown of carbohydrates and fats in a process called cellular respiration. When there is enough oxygen available, this process can continue aerobically, producing ATP (adenosine triphosphate) and carbon dioxide. However, during intense exercise, the demand for ATP exceeds the body’s ability to supply it through aerobic respiration, leading to an oxygen debt.
The oxygen debt is defined as the amount of oxygen required after exercise to return the body to its resting state. This oxygen is needed to restore the levels of ATP and creatine phosphate (CP) in muscle fibers and to clear out the lactic acid that accumulates during anaerobic metabolism.
The formation of oxygen debt occurs during the anaerobic phase of exercise when there is a shortage of oxygen available for cellular respiration. Instead, the body produces ATP through anaerobic metabolism, which results in the production of lactic acid. Lactic acid causes muscle fatigue and soreness, leading to a decreased ability to perform work.
After exercise, the body repays the oxygen debt by increasing oxygen intake. This increased oxygen intake is used to restore the levels of ATP and CP in muscle fibers, convert lactic acid to pyruvate and ultimately carbon dioxide, and restore the body’s normal metabolic rate.
The repayment of oxygen debt typically occurs within a few minutes to several hours after exercise, depending on the intensity and duration of exercise. The amount of oxygen consumed during the repayment of the oxygen debt can be measured, and this measure is often used as an indicator of the body’s metabolic rate during and after exercise.

IBDP Study Notes

IB Comprehensive Syllabus

IB IA Ideas

IB CAS Ideas