Uncertainties and errors in measurement and results
Uncertainty in measurement
- In science numerical data can be divided into two types:
- data involving exact numbers (that is, the values are known exactly – there is no uncertainty)
- data involving inexact numbers (for these types of numbers there is a degree of uncertainty).
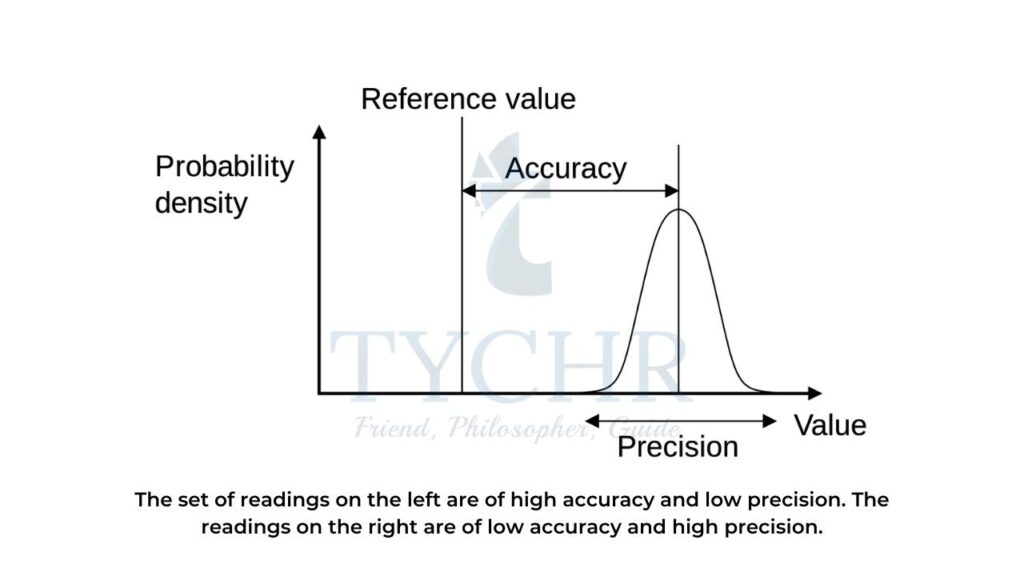
Difference between precision and accuracy
Precision | Accuracy |
Precision means how close the results are with each other. | Accuracy means how close the results to the actual value. |
Precision does not take into account the accepted value. | Accuracy takes into account the accepted value. |
Precision has multiple factors. | Accuracy has a single factor. |
It is concerned with random error. | It is concerned with a systematic error. |
Table 1: Difference between precision and accuracy.
Significant figures
- Significant figures refer to the number of digits reflecting the precision of a given measurement.
- The greater the number of significant figures, the greater the certainty about the numerical value of the measured or calculated quantity.
- In order to know the number of significant figures associated with a measurement, it is useful to express the measured parameter in scientific notation (sometimes called exponential notation).
Measurement | Scientific notation | Number of SFs |
135.680 g | 1.35680 × 10² g | six |
0.00620 dm3 | 6.20 × 10 -3 dm3 | three |
6.00 kg | 6.00 kg | three |
2.0600 m3 | 2.0600 m3 | five |
0.2 mg | 2 × 10 -1 mg | one |
300 kg* | 3 × 10² kg* | one |
Table 2: *If a number is expressed with no decimal point, for example 300 kg, then it is assumed that the zeros are not significant. Hence 300 kg has just one SF.
- In numerical calculations dealing with measured quantities, significant figures should always be taken into account. These are handled employing two simple rules:
- For an operation involving multiplication or division: The result should be expressed based on the measurement with the smallest number of significant figures.
- For an operation involving addition or subtraction: The result should be expressed based on the measurement with the smallest number of decimal places.
- Significant figures associated with logarithms (logs) need to be handled carefully in calculations. The log of a number is defined mathematically as the power to which the base can be raised to get that number. A log is composed of two parts:
- The characteristic – the integer part
- The mantissa – the decimal part
Experimental errors
Basis For Comparison | Random Error | Systematic Error |
Definition | The random error occurs in the experiment because of the uncertain changes in the environment. | It is a constant error which remains the same for all the measurements. |
Causes | Environment, limitation of the instrument, etc. | Incorrect calibration and incorrectly using the apparatus |
Minimize | By repeatedly taking the reading. | By improving the design of the apparatus. |
Magnitude of error | Vary | Constant |
Direction of error | Occur in both the direction. | Occur only in one directions. |
Types | Do not have | Three (Instrument, Environment and systematic error) |
Table 3: Difference between random and symmetric errors.
Graphical techniques
- Graphical techniques are an effective means of communicating the effect of an independent variable on a dependent variable, and can lead to the determination of physical quantities.
- Sketched graphs have labelled but unscaled axes, and are used to show qualitative trends, such as variables that are proportional or inversely proportional. Units generally would not need to be shown on a sketch, only the variables.
- Drawn graphs have labelled and scaled axes, and are based on quantitative measurements. Drawn graphs always display the appropriate units for variables.
- There are a number of features that you are required to know for graphs:
- the slope or gradient of a line, m
- the intercept, c
- the idea of a “best-fit” line.
The slope or gradient of a line, m
- Mathematically, the slope of a line, m, is the tangent of the angle, θ, that the line makes with the positive direction of the x-axis. In order to find the slope of a line, we need to choose two points on the line, ideally well separated from each other, (x1, y1) and (x2, y2).
m =(∆y/∆x)=((𝑦2− 𝑦1)/(𝑥2− 𝑥1))
- Where there is an incline of the line in the positive direction of the x-axis, the gradient will have a positive value; where there is a decline of the line in the positive direction of the x-axis, the gradient will have a negative value.
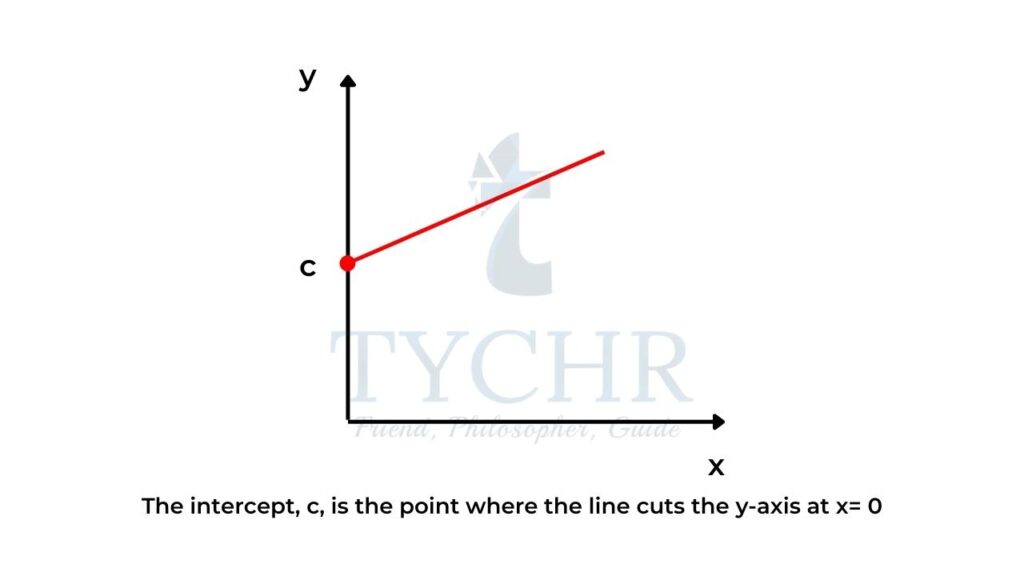
The intercept, c
- The intercept, c, is the point where the line cuts the y-axis at x = 0 (figure 2).
- The intercept can be found by two methods:
- using extrapolation
- using the equation of a line, y = mx + c
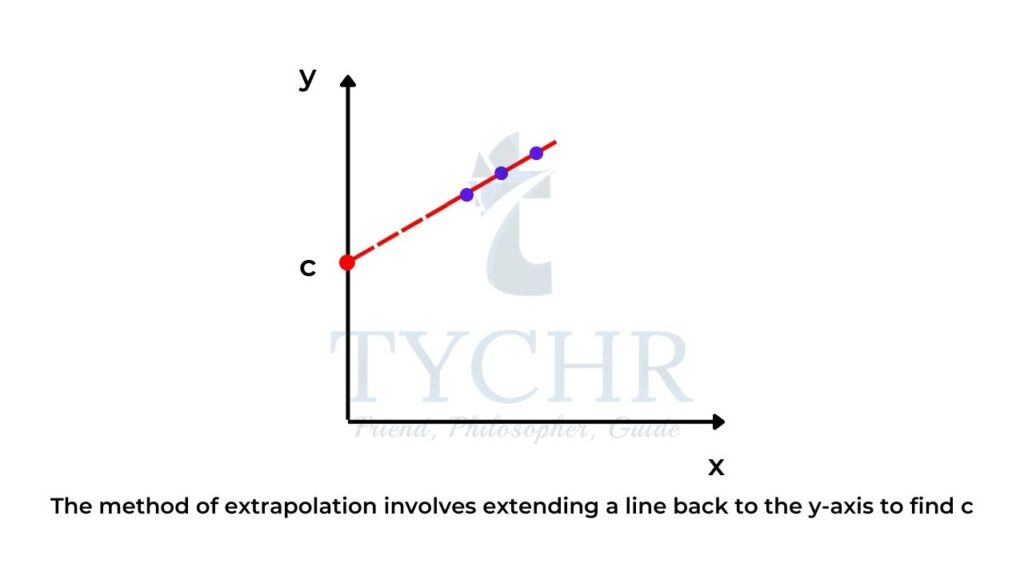
- Sometimes when we plot a graph, it is more convenient to draw the graph with appropriate scales where the x-axis scale begins at a point greater than zero as the data points may not be located at zero on the x-axis.
- If this is the case, by extrapolation you can simply extend the line back to the y-axis to find c.
- Alternatively, you could choose some point on the line, (xc, yc), and use the equation of the line y = mx + c to find c, as long as you know m:
c = yc – mxc
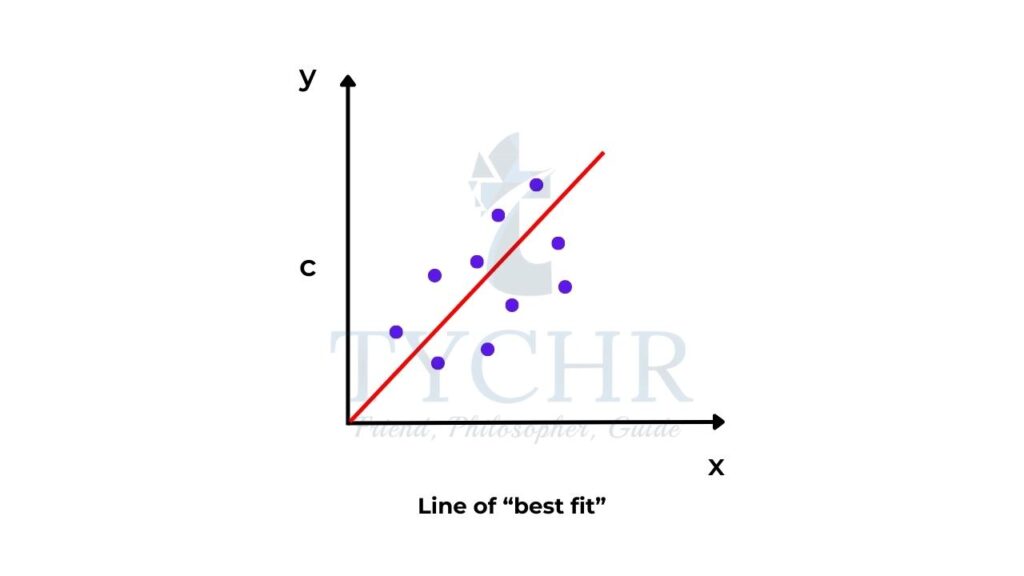
The idea of a “best-fit” line
- When we plot data obtained from an experiment you may find that, although there is a linear relationship, not all the data points lie exactly on the line. For this purpose, it is best to draw a line of best fit (figure 4).
Spectroscopic identification of organic compounds
Degree of unsaturation or index of hydrogen deficiency (IHD)
- The degree of unsaturation or index of hydrogen deficiency (IHD) can be used to determine from a molecular formula the number of rings or multiple bonds in a molecule.
- The degree of unsaturation is used to calculate the number of rings and π bonds present in a structure, where:
- a double bond is counted as one degree of unsaturation
- a triple bond is counted as two degrees of unsaturation
- a ring is counted as one degree of unsaturation
- an aromatic ring is counted as four degrees of unsaturation.
- The IHD can be worked out two ways:
- from the structure
- from the molecular formula.
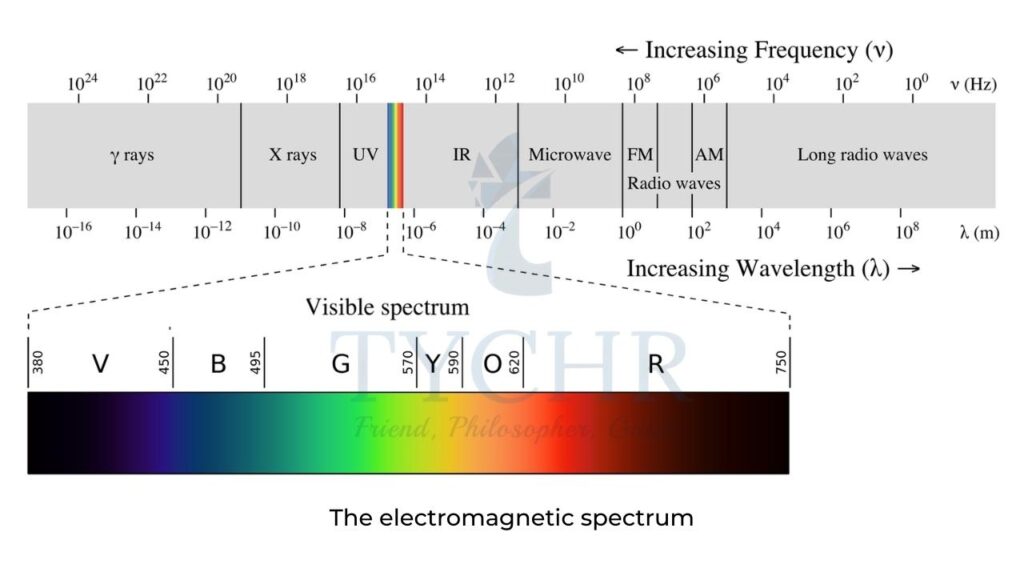
Electromagnetic spectrum (EMS)
- The energy of electromagnetic radiation, E, is related to the frequency, ν, of the radiation by Planck’s equation: E = hν = hc/λ
- where: h = Planck’s constant = 6.63 × 10⁻³⁴ J s
- The various regions of the EMS are the basis of different types of spectroscopy (which is the study of the way matter interacts with radiation) and various techniques are used to identify the structures of substances:
- X-rays – as their energy is high, these cause electrons to be removed from the inner energy levels of atoms. Diffraction patterns can lead to information such as the bond distances and bond angles in a structure and form the basis of X-ray crystallography.
- Visible and ultraviolet (UV) light give rise to electronic transitions and hence this type of spectroscopy gives information about the electronic energy levels in an atom or molecule. This is the basis of UV-vis spectroscopy
- Infrared radiation causes certain bonds in a molecule to vibrate (for example, stretch and bend) and as such provides information on the functional groups present. This is the basis of IR spectroscopy
- Microwaves cause molecular rotations and can give information on bond lengths.
- Radiowaves can cause nuclear transitions in a strong magnetic field because radiowaves can be absorbed by certain nuclei, which causes their spin states to change. Nuclear magnetic resonance (NMR) spectroscopy is based on this and information on different chemical environments of atoms can be deduced, which leads to information on the connectivity of the atoms present in a molecule.
Infrared spectroscopy
- Unlike UV and visible radiation, IR radiation does not have sufficient energy to result in electronic transitions, but can cause molecular vibrations, which result from the vibration of certain groups of molecules about their bonds.
- Hence, using this type of spectroscopy various functional groups can be identified in a molecule. The vibrational transitions correspond to definite energy levels.
Proton nuclear magnetic resonance ( 1HNMR) spectroscopy
- 1HNMR spectroscopy gives information on the different chemical environments of hydrogen atoms in a molecule and is possibly the most important structural technique available to the organic chemist.
- The nuclei of hydrogen atoms can exist in two possible spin states.
- In a 1H NMR spectrum, the position of the NMR signal relative to a standard (tetramethylsilane, TMS) is termed the chemical shift, δ, expressed in parts per million (ppm), of the proton. δ for TMS is assigned as 0 ppm. Hydrogen nuclei in the different chemical environments have different chemical shifts.
- Another useful feature of a 1HNMR spectrum is that it contains an integration trace that shows the relative number of hydrogen atoms present. In the case of the 1HNMR spectrum for methanoic acid this will be 1:1.
- An important application of 1HNMR spectroscopy is associated with the fact that the protons in water molecules within human cells can be detected by magnetic resonance imaging (MRI), which gives a three dimensional view of organs in the human body.
Mass spectrometry (MS)
- When a gaseous molecule is ionized its molecular ion, M+, is formed.
- The molecular ion peak in a mass spectrum corresponds to the molecular mass of the compound.
- Owing to the highly energetic ionization process involved in a mass spectrometer, the molecule can, in fact, break up into smaller fragments, some of which will be ions. The fragmentation pattern observed in a mass spectrum provides further information on certain functional groups present in a molecule.
Spectroscopic identification of organic compounds
High-resolution 1HNMR spectroscopy
- A high-resolution 1HNMR spectrum can show further splitting of some absorptions.
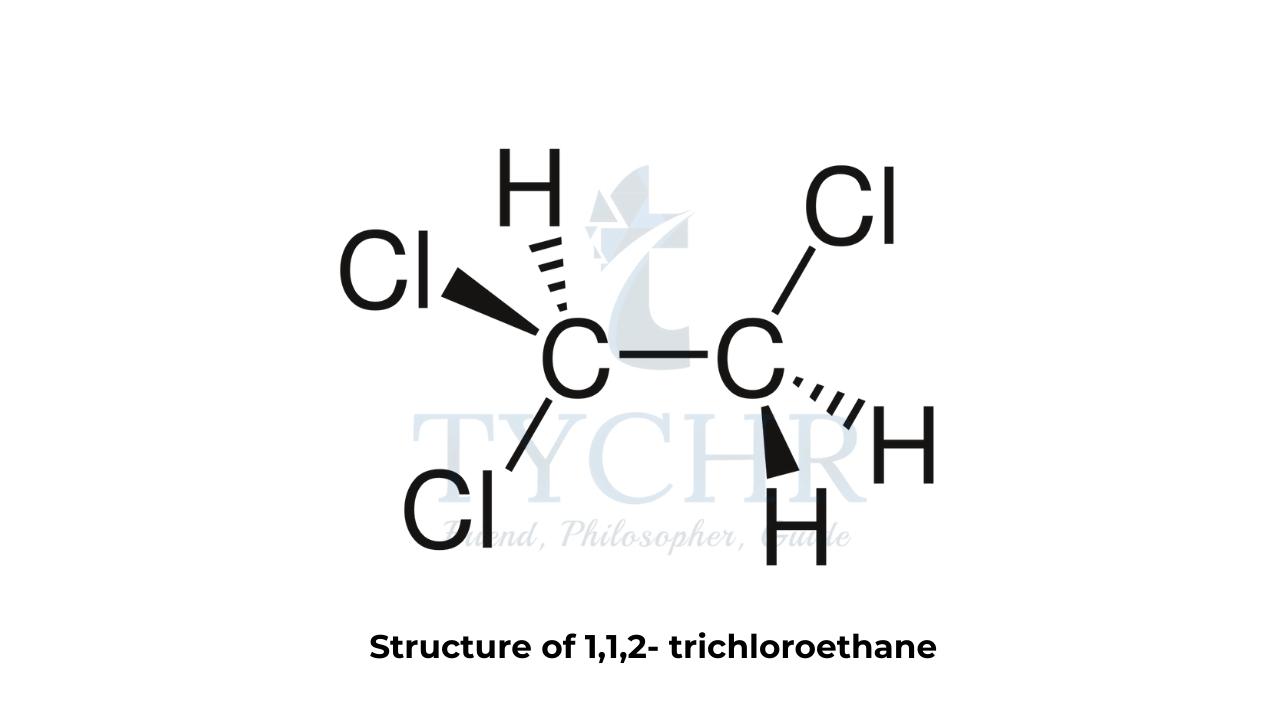
- Splitting patterns result from spin–spin coupling. To understand spin–spin coupling, let us take the example of the 1H NMR spectrum of 1,1,2-trichloroethane, whose structure is shown in figure 2(a).
- The molecule contains two types of hydrogen in different chemical environments. Let’s call these two different types of hydrogen Ha and Hb , respectively.
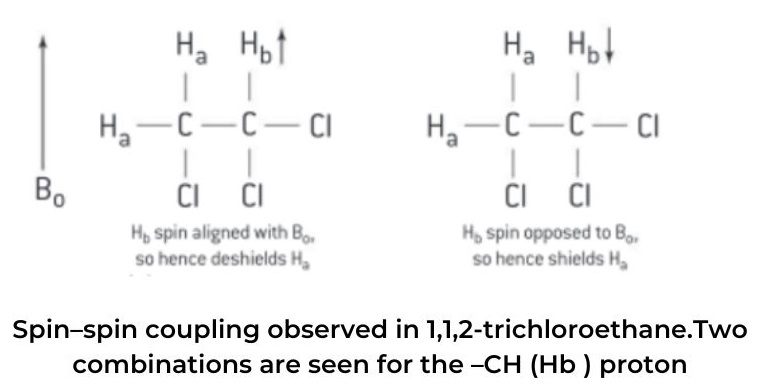
combinations are seen for the –CH (Hb ) proton
- Therefore, the signal that will be observed for the methylene protons, CH2 (Ha) will appear as a doublet, (d), in the high-resolution 1HNMR spectrum.
- This doublet consists of two lines of the same relative intensity. One of the two lines is located slightly upfield from the original single peak observed in the low-resolution spectrum – this is due to 50% of the molecules having their Has shielded by Hb (Hb spin opposing Bo ) and the peak will appear at a lower chemical shift, δ.
- In the other case where the signal has moved slightly downfield from the original single peak in the low-resolution spectrum, 50% of the molecules will have their Has deshielded by Hb (spin of Hb aligning with Bo) and the peak will appear at a higher chemical shift, δ. The ratio of the intensities of the two lines of the doublet, (d), can be deduced using Pascal’s triangle and will be 1:1.
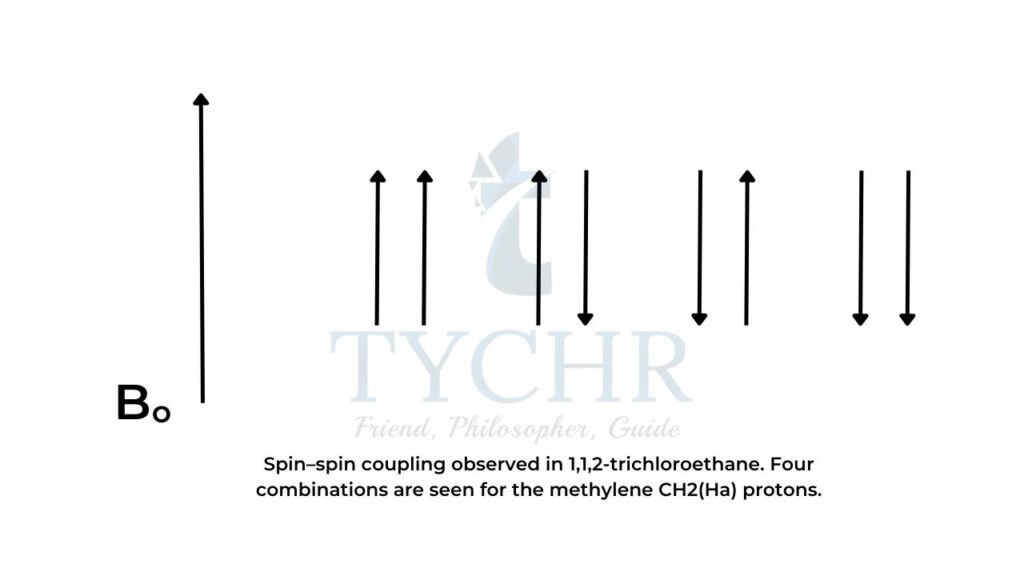
- In the case of the methylene CH2 (Ha ) protons, four combinations are possible:
- Combination 1: Ha1 and Ha2 magnetic moments aligned with Bo (deshields Hb , so signal is shifted downfield to a higher δ).
- Combination 2: Ha1 magnetic moment aligned with Bo and Ha2 magnetic moment aligned against B
- Combination 3: Ha1 magnetic moment aligned against Bo and Ha2 magnetic moment aligned with B
- Combination 4: Ha1 and Ha2 magnetic moments aligned against Bo (shields Hb , so signal is shifted upfield to a lower δ).
Single-crystal X-ray crystallography
- The structural technique of single crystal X-ray crystallography can be used to identify the bond lengths and bond angles of crystalline compounds.
- The chemical community often shares chemical structural information on the international stage.