Market Failure
It occurs when the price mechanisms (forces of supply and demand) fail to allocate resources efficiently. Scarce resources are allocated inefficiently leading to either overprovision (many resources allocated) or under provision (few resources allocated).
Externalities: Private and social benefits and costs:
An externality occurs when producer’s/consumer’s actions have positive/negative effects on other people not involved in the actions.
- If the effect benefits the third party, there is a positive externality(or spillover) benefit. Eg- national defense, police and emergency services, public parks/libraries.
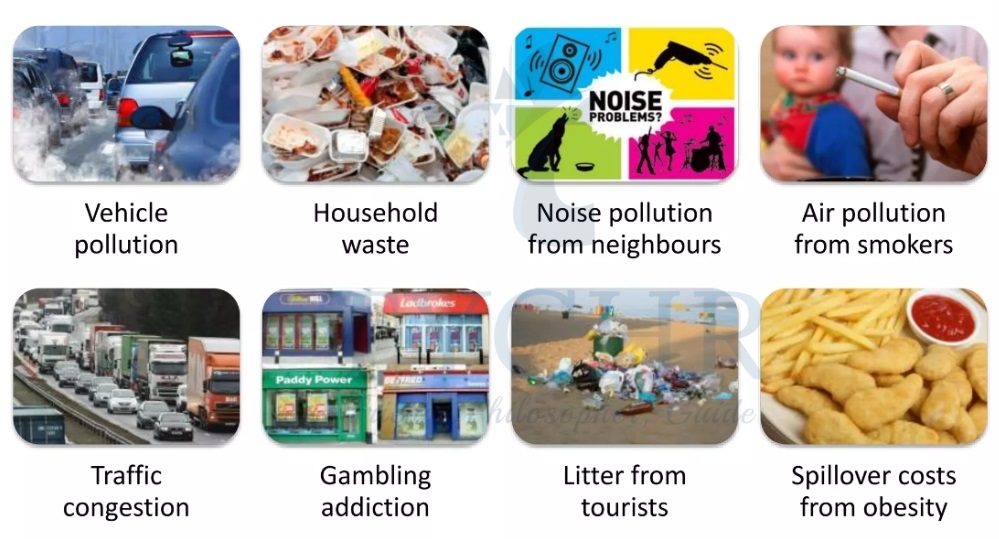
- If it harms the third party, there is a negative externality (or spill over) costs.
For e.g.- Public Smoking
Note:
- Marginal Private Costs (MPC) It refers to costs to producers of producing one more unit of a good.
- Marginal Social Costs (MSC) It refers to the costs to society of producing one more unit of a good.
- Marginal Social Benefits (MSB) It’s about the benefits to society that come from buying more of something.
Demand, Supply and allocative efficiency with no Externalities
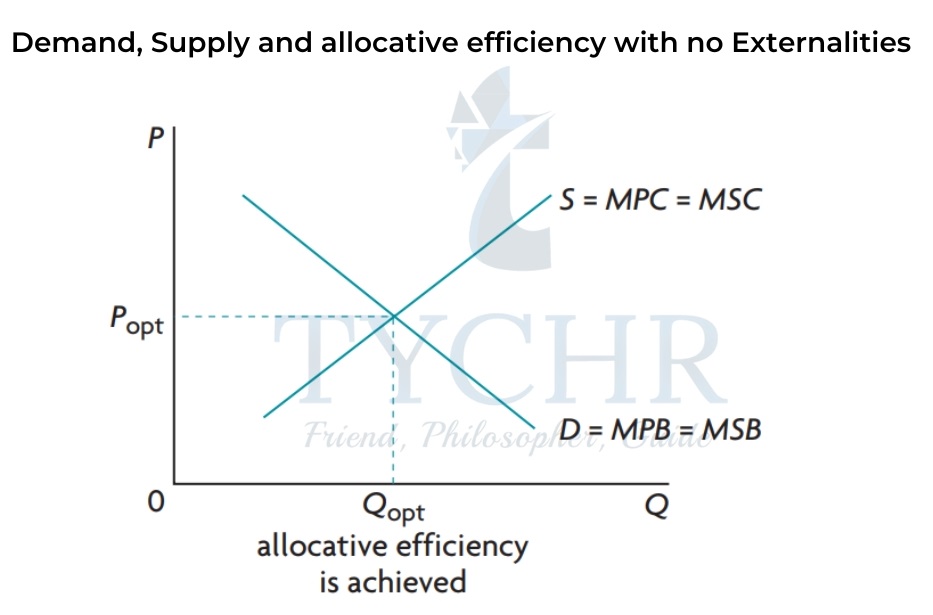
Demand curve = Marginal benefits curve
Supply = Marginal costs curve
Allocative efficiency is reached when MSC=MSB. When there is no externality, the competitive free market leads to an outcome where MPC=MSC=MPB=MSB, as in the above figure, indicates allocative efficiency. An externality creates a divergence between MPC and MSC or between MPB and MSB. When there is an externality, MPB=MPC, but where MSB≠MSC, indicating Allocative inefficiency.
Negative Externalities of Production and Consumption
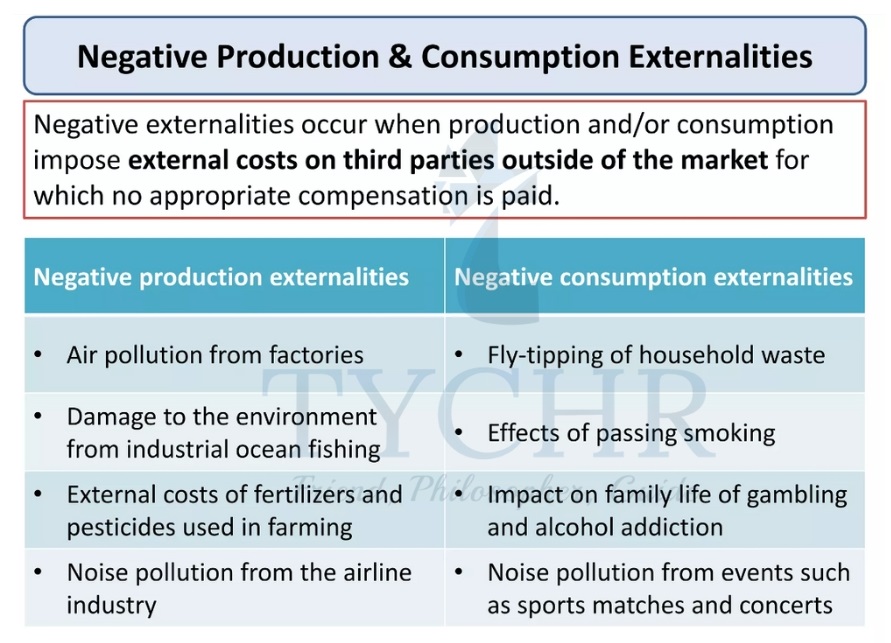
Negative Production Externalities
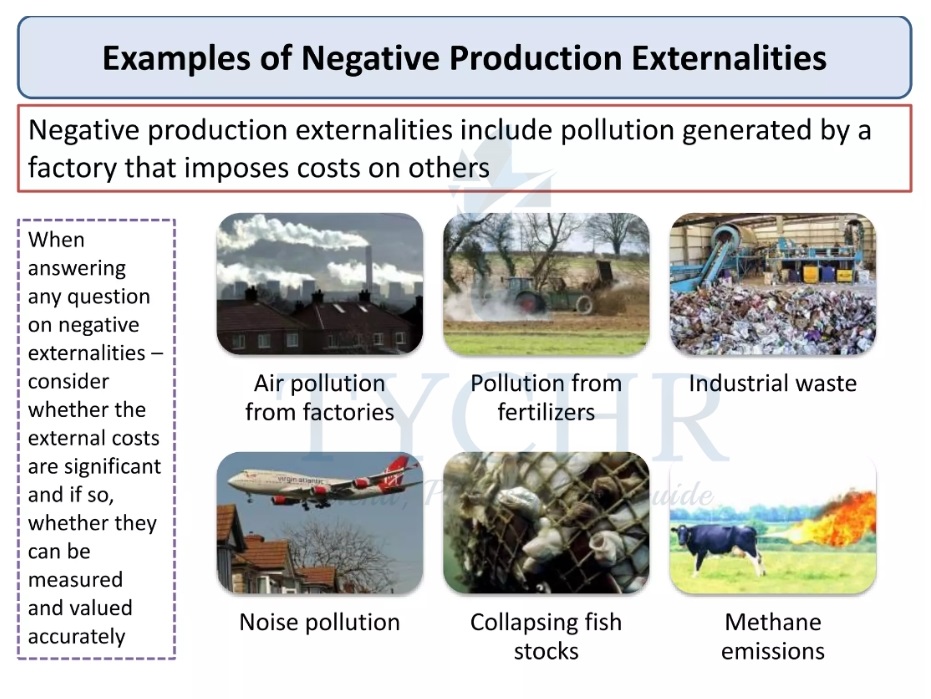
Negative production externalities are external costs created by producers. It means too much is being allocated to the production of the goods. Over and above the firm’s private costs of production there are additional costs like pollution, etc.
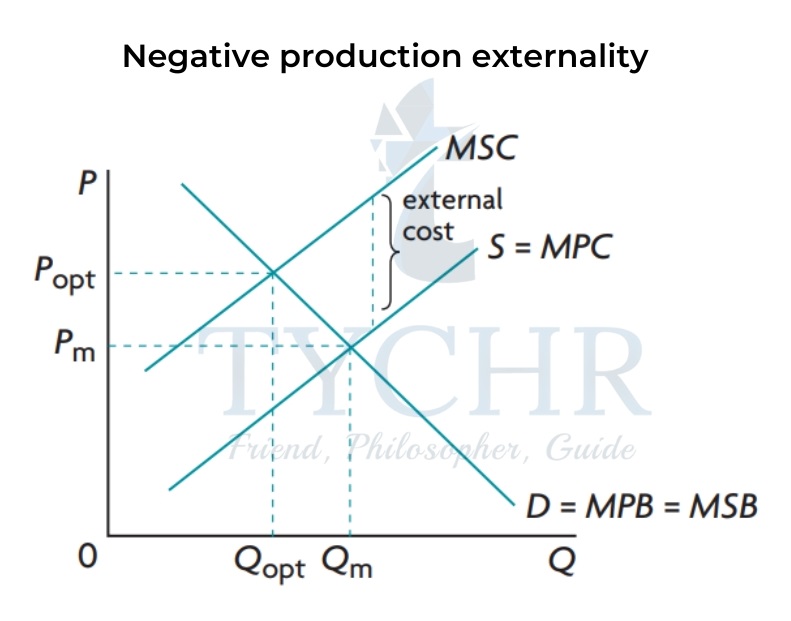
- In a free market economy, with no government intervention, output will be at Qm = Pm , where MPC=MPB.
- However, the socially optimum output is at Qopt =Popt , where consumption levels are low and prices are high and where MSB=MSC.
- There is welfare loss, loss in social benefits, a yellow shaded area which is equal to the difference between MSC and MSB and overproduced products. This means that social costs are greater than firm’s private costs of production.
Corrections
Government Regulations
- Government uses its authority to make regulations to reduce/ prevent externalities.
- Lowers the quantity produced so that the MPC curve shifts up towards MSC.
Market Based Policies (Tax)
- Government can impose tax per unit of output produced or per unit of pollutants emitted.
- Shifts supply curve from S=MPC to MSC (or MPC+tax).
- Best to shift it so that it overlaps with the MSC curve.
Tax on output/ Tax on pollutants
- A tax on output works by correcting overallocation of resources and reducing overall output.
- By providing firms with incentives to use resources that are less polluting, a pollutant tax works.
- A carbon tax is a tax per unit of carbon emission: The more carbon emitted, the higher the tax.
Market Based Policies (Tradable permits)
- Governments can also issue tradable permits (cap and trade schemes) to firms that permit them to produce a certain amount of pollutants.
- If they need more, they can trade with other firms.
- The supply curve of these permits is perfectly inelastic because there is a fixed number of permits.
- Encourage firms to use less polluting resources so they don’t need to use permits.
Negative Consumption Externalities
When a consumer smokes in public places there are external costs that spill over onto society in the form of costs to non smokers due to passive smoking.
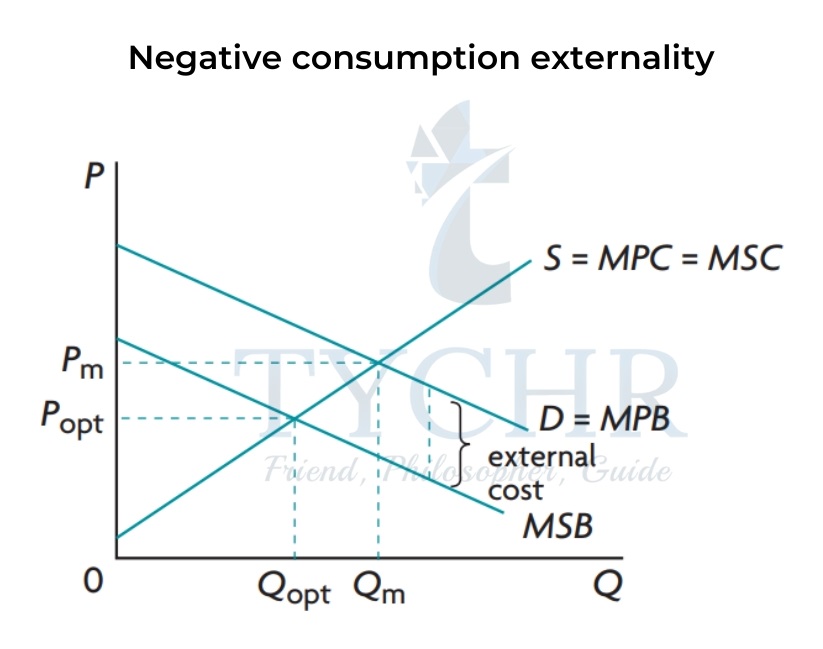
- Buyers of cigarettes have an MPB demand curve but when smoking due to external costs, the MSB curve lies below MPB.
MPB – MSB = External cost - In a free market economy, output will be at Qm and Pm where MPC = MPB.
- However, Socially optimum output is at Qopt and Popt , determined by the intersection of MSB and MSC curves.
- There is overconsumption of demerit goods like cigarettes in the absence of government intervention.
- The yellow shaded area is the welfare loss.
Note: Products that consumers don’t want are known as demerit goods.
E.g.- cigarettes, alcohol and gambling, etc.
Corrections
- Government regulations – Regulations to limit activities will shift the D = MPB curve.
- Advertising – It might convince customers to use less of a product, which would lower demand.
- Market Based Policies – Imposition of excise tax will decrease the supply and shift supply curve upwards.
Evaluations
Positive Externalities of Production and Consumption
Positive externalities occur when production and consumption create benefit to third parties.
Positive Production Externality
It refers to external benefits created by producers. Eg- Research and development, new technology, invention/discovery of new medicine, trained/skilled workers, etc.
The production of goods is underserved by the market: It is produced with insufficient resources, and insufficient quantities of the product are produced. This is shown by Qm <Qopt and MSB>MSC at Qm.
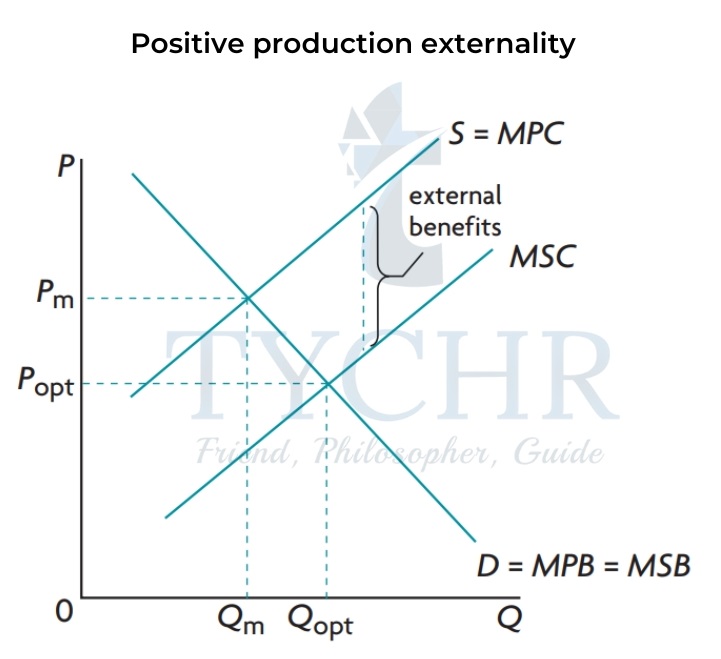
In the above figure the shaded area is the welfare loss, the benefits lost because not enough of a good is being produced.
Corrections
- Government Provision – The government can finance research and development and training. The cost of this is covered by the government. The MPC curve is shifted toward the MSC curve as a result.
- Subsidies – The government can provide a subsidy and shift the S = MPC curve towards the MSC curve.
Positive Consumption Externality
In this case, external benefits are created by consumers which benefits the entire society. E.g.- education, low crime rates, etc.
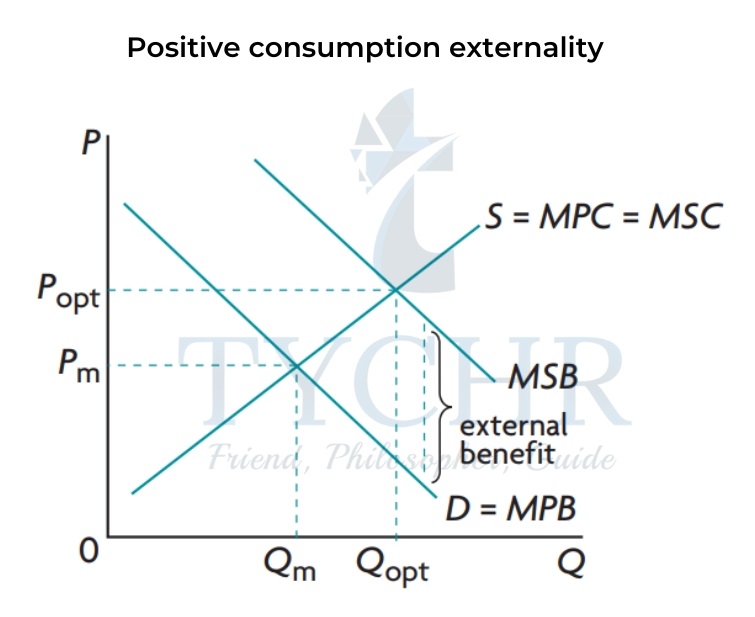
The market underallocated resources. Qm<Qopt and MSB>MPB at Qm.
The shaded area is the welfare lost and represents lost benefits because of externality.
Merit Goods
They are goods that are desirable for consumers but are underprovided.
Reasons for underprovision
- Positive externality.
- Low levels of income and poverty.
- Consumer ignorance.
Corrections
- Legislation – It promotes greater consumption, which shifts the MPB curve closer to MSB. Many countries have made education mandatory.
- Advertising – Promotes consumption.
- Direct government provision – Like education and healthcare resulting in increasing supply.
- Subsidies
Evaluations
Lack of Public Goods
Private and Public Goods
- A private good is rivalrous and excludable.
- Rivalrous – One person’s consumption reduces availability for others.
- Excludable – The good might prevent people from using it, usually because it costs too much.
- A public good is non-rivalrous and non-excludable (AKA pure public good)
- Non-rivalrous – Consumption by one doesn’t reduce consumption for someone else.
- Non-excludable – It is impossible to prevent individuals from using the product.
public goods include: national defense, police force, etc.
- A Quasi-public good is non-rivalrous but excludable.
- Examples are museums and toll roads because they exclude those that can’t pay.
Example of private goods
Examples of private goods include food, cars, movie tickets, clothing, private gyms, and Exclusive clubs.
Examples of public goods
Examples of public goods include fresh air, law enforcement, and national defense.
Free Rider Problem
It comes from non-excludability because people can’t be excluded from the use of a good. Private businesses are unable to produce these goods as a result of the Free Rider Problem, resulting in resource misallocation.
Corrections
- Public goods are directly provided by the government, so are made free of charge.
- Which ones to provide and in what quantity? Government has opportunity costs.
- Government needs to perform a cost-benefit analysis to see the benefits of a certain public good. If benefits are less than costs, good shouldn’t be provided.
- Costs are easy to estimate, but the benefits are hard. Some people exaggerate values.
The Danger of Common Access Resources to Sustainability:
Common Access Resource and Market Failure
- Resources with no price and no ownership are known as common access resources. For example – Clean air, fish, rivers, ozone layer, etc. They are rivalrous but non-excludable.
- Overused by consumers and producers because of non-excludability.
- Common access resources used without payment can cause serious environmental problems.
Sustainability
- It is the ability of something to be maintained or preserved overtime.
- Conflicts between environmental and economic goals:
- Focusing on economic goals could cause destruction of the environment.
- Focusing on environmental goals could result in unsatisfiable needs/wants.
- Sustainable development – It is progress that meets the needs of the present without compromising the ability of future generations to satisfy their own requirements.
- Sustainable resource use – It is using resources at a rate so that they don’t get depleted.
Pollution
- Pollution of affluence – Pollution caused because of high consumption that relies on the use of fossil fuels and open access resources.
- Negative externality of production.
- Pollution of sustainability – Environmental destruction caused by overexploitation by poor people because of the lack of modern technology.
- For example- they drain the nutrients of the soil by over watering, making it less productive.
- Sustainability is threatened by the increased economic activities.
Government Response
- Legislation
- The government limits threats to sustainability by having licenses, permits, restrictions, etc.
- They are easy to put in effect and oversee, and are effective. However, they don’t offer incentives.
- Carbon taxes vs Cap and Trade schemes
- Carbon Tax- It is a tax on carbon usage : fuels that have a higher carbon emission are taxed more.
- Gives incentive for producers to switch to cleaner fuels.
- Makes energy prices more predictable.
- Easier to implement and can be applied to all users of fossil fuels.
- No manipulation and little monitoring.
- Less likely used to restrict competition.
- May be set to low.
- Can’t target a particular level of reduction.
- Regressive.
- Must be adjusted for inflation.
- Tradable permits – A cap of total CO2 enforced and permits are distributed. Useless if the caps are set too high.
Clean Technologies
- They aim towards a more responsible and productive use of resources.
- Currently available, but their potential has not yet been discovered due to a lack of policies.
- Funding for them has opportunity costs – governments should allocate resources to this area.
International Cooperation
- Co-operation amongst governments can be effective to reduce environmental damages. Examples include the Montreal Protocol to phase out ozone – depleting substances and the Kyoto Protocol to reduce carbon emissions.