Ecosystems and Ecology
2.1 Species and Populations
2.1.1 Species, Habitat, Niche
- Species- A species can be defined as a group of organisms that interbreed and produce fertile offspring. An example of a species is the lion, Panthera leo.
- Habitat- A species’ typical biotic and abiotic environment is known as its habitat. Lions, for instance, can be found in open woodland, grassland, savanna, and dense scrub.
- Niche- An ecological niche is best described as where, when, and how an organism lives. An organism’s niche depends not only on where it lives (its habitat) but also on what it does. A niche is the particular collection of biotic and abiotic conditions and resources to which an organism or population responds.
- Fundamental niche- Can be simply defined as where and how an organism could live.
- Realised niche- Is where and how an organism does live.
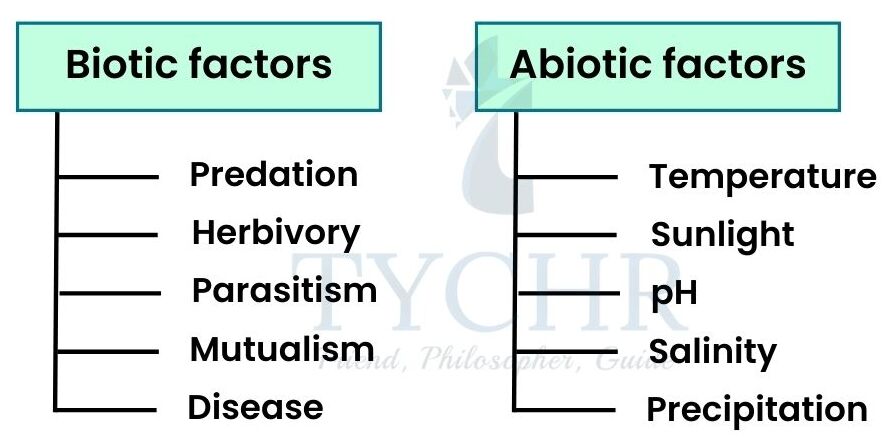
- Abiotic Factors- Are non-living parts of the environment and these factors determine the fundamental and realised niche of species.
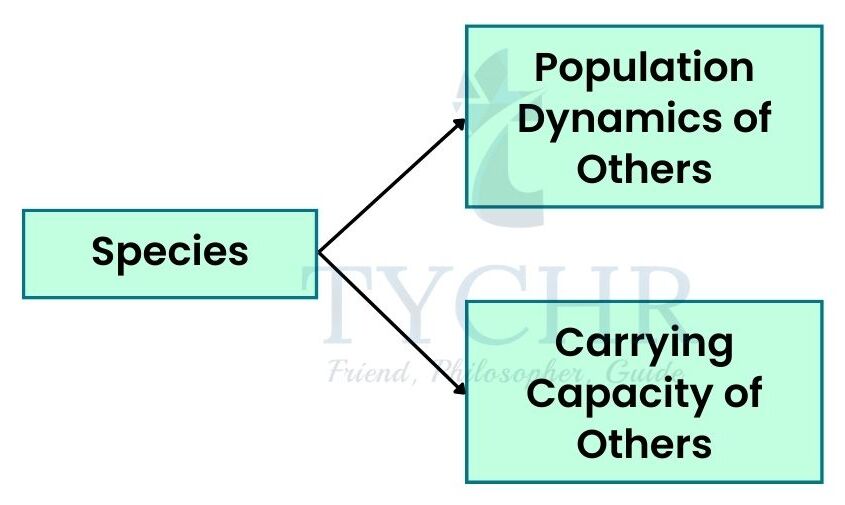
- Biotic Factors- Are the living part of the environment. Interactions between organisms are also biotic factors. Ecosystems contain numerous populations with complex interactions between them. The nature of the interactions varies.
2.1.2 Population Interactions
Predation | Herbivory | Parasitism | Mutualism | Disease |
Predation occurs when one animal hunts and eats another organism. | Herbivory is an interaction where an animal feeds on a plant. | One organism gets its food from another organism that does not benefit from the relationship. | Mutualism is an interaction in which both species benefit. | An organism that causes disease is known as a pathogen. |
are frequently governed by population densities-controlling negative feedback mechanisms. The carrying capacity of the prey and predator is affected because of the negative feedback. | The carrying capacity of herbivores is affected by the quantity of the plant they feed on. An area with more abundant plant resources will have a higher carrying capacity. | The organism that benefits is called the parasite. The organism from which the parasite gets its food is called the host. The carrying capacity of the host may be reduced because of the harm caused by the parasite. | This is a symbiotic relationship. | The disease-causing species may reduce the carrying capacity of the organism it is infecting. Changes in disease can also cause populations to increase and decrease around the carrying capacity. |
Eg: Lion that kills a deer. | Eg: Caterpillar feeding, eating a leaf. | Eg: Rafflesia. | Eg: Corals and unicellular algae. | Eg: Dutch elm disease caused by fungus. |
2.1.3 Competition
When resources are limited, individuals must compete in order to survive. This competition can be either within a species or between individuals of different species. When competition is within a species it is called intraspecific competition. When competition is between different species it is called interspecific competition.
2.1.4 Population Growth
S Population Curve | J Population Curve |
In such a population, there is an initial rapid growth (exponential growth) which then slows down as the carrying capacity is reached.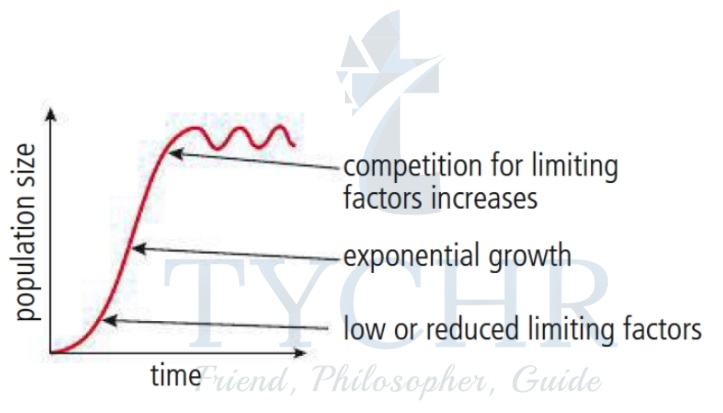 | In some populations, exponential growth is at an increasing or accelerating rate of growth. Growth is initially slow but becomes increasingly rapid, and does not slow down as population Growth . |

2.1.5 Limiting Factors
For plants: light, nutrients, water, carbon dioxide, and temperature. For animals: space, food, mates, nesting sites, and water. The carrying capacity of a population is affected by various limiting factors, such as:
- The availability of food and water
- Territorial space
- Predation
- Disease
- Availability of mates
2.2 Communities and Ecosystem
A community is many species living together, whereas the term population refers to just one species.
Communities include all biotic parts of the ecosystem, both plants and animals.
An ecosystem is a community of interdependent organisms and their physical environment, or abiotic component. There are three kinds of ecosystems: freshwater, marine, and terrestrial
2.2.1 Photosynthesis and Respiration
Photosynthesis converts light energy to chemical energy, which is stored in biomass.
Respiration releases energy from glucose and other organic molecules inside all living cells. It begins as an anaerobic process in the cytoplasm of cells, and is completed inside mitochondria with aerobic chemical reactions occurring.
The process is controlled by enzymes.
𝐺𝑙𝑢𝑐𝑜𝑠𝑒 + 𝑂𝑥𝑦𝑔𝑒𝑛 → 𝐶𝑎𝑟𝑏𝑜𝑛 𝐷𝑖𝑜𝑥𝑖𝑑𝑒 + 𝑊𝑎𝑡𝑒𝑟
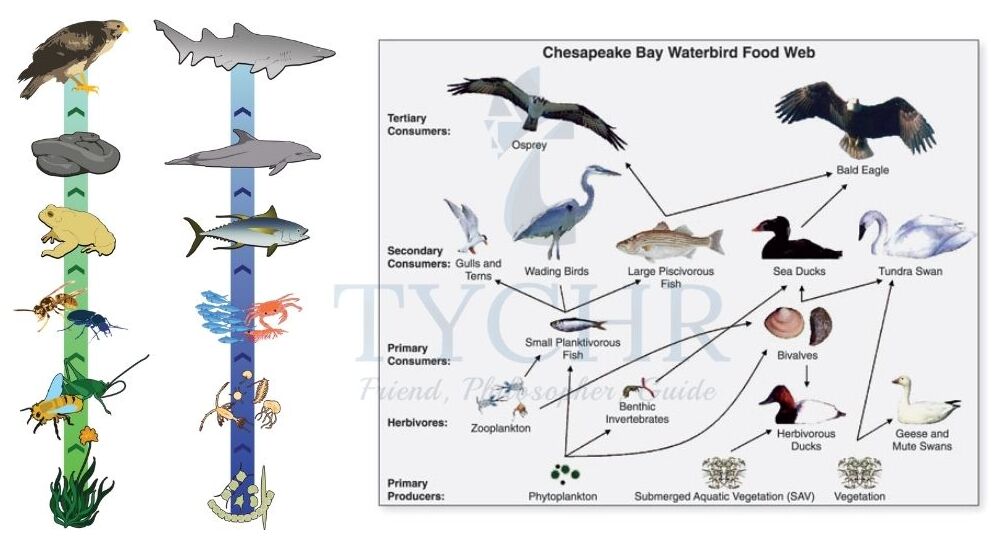
2.2.2 Feeding Relationships
Producers | Consumers | Decomposers |
Producers are organisms in an ecosystem which convert abiotic components into living matter. They support the ecosystem by constant input of energy and new biological matter. Also called autotrophs. | Because they lack photosynthetic pigments like chlorophyll, consumers are organisms that consume other organisms for energy and matter. These organisms cannot produce their own food. Also called heterotrophs. | Decomposers obtain their food and nutrients from the breakdown of dead organic matter. Decomposers also contribute to the build-up of humus in soil. |
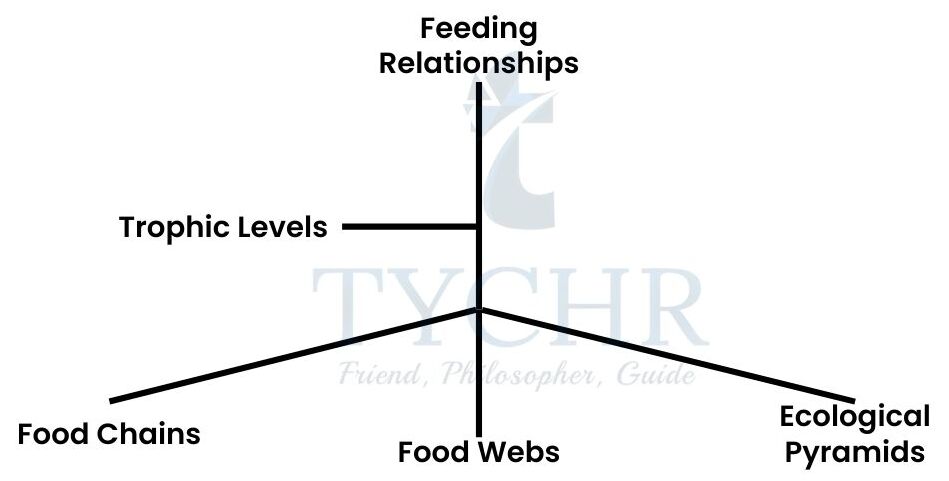
2.2.3 Trophic levels, Food Chains and Food Webs
Let’s Revise
Fundamental niche- The full range of conditions and resources in which a species could survive and reproduce.
Realized niche- The actual conditions and resources in which a species exists due to biotic interactions.
Niche- The abiotic and biotic conditions and resources to which an organism or pop
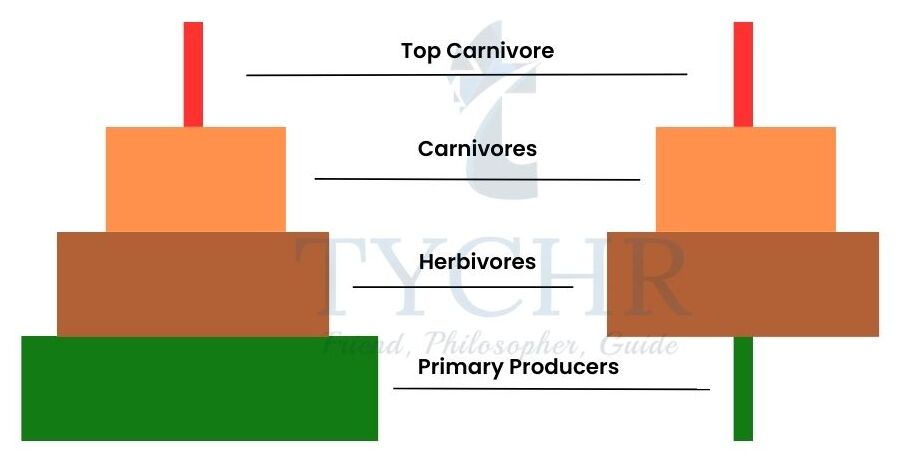
2.2.4 Pyramids of Numbers, Biomass, and Productivity
- A pyramid of numbers represents the number of organisms (producers and consumers) coexisting in an ecosystem.
- A pyramid of biomass represents the quantities of matter and energy stored at each trophic level, such as grams of biomass per square meter (gm–2)
- Pyramids of biomass represent the momentary stock, whereas pyramids of productivity show the rate at which that stock is being generated.
Pyramid Structure and Ecosystem Functioning - The second law of thermodynamics states that biomass tends to decrease along food chains, so pyramids narrow as trophic levels rise because energy decreases along food chains.
- A reduction in the numbers of producers or primary consumers can threaten the existence of the top carnivores when there are not enough of the producers or primary consumers (and therefore energy and biomass) to support the top carnivores.
- Because of their relatively small populations, top carnivores may be the first population we notice to suffer through ecosystem disruption.
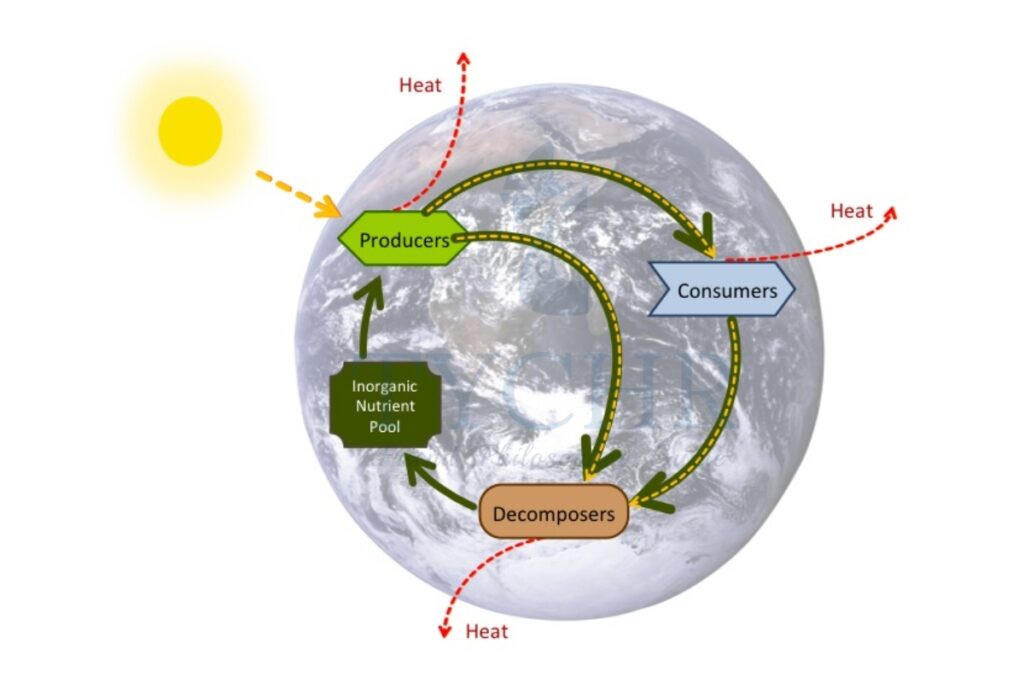
2.3 Flows of Energy and Matter
2.3.1 Transfer and Transformation of Energy
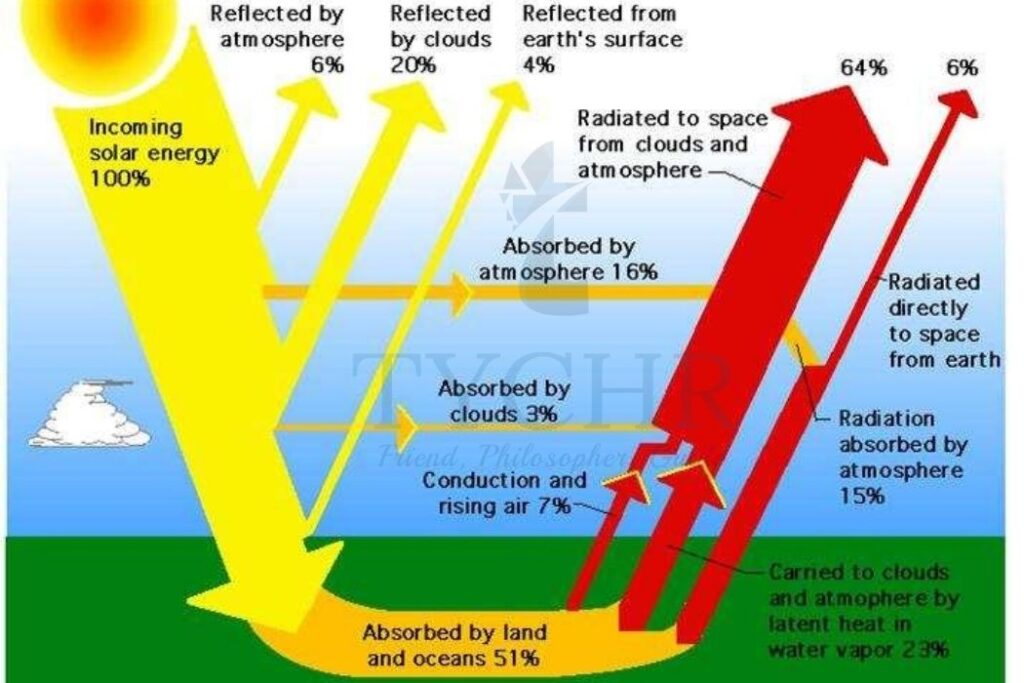
Pathways of Radiation through the Atmosphere
Not all sunlight emitted by the Sun is used by plants for photosynthesis.
2.3.2 Primary and Secondary Productivity
- Primary Productivity – the gain by producers (autotrophs) in energy or biomass per unit area per unit time.
o Gross Primary Productivity (GPP)-is equivalent to the mass of glucose produced per unit area and time by primary producers through photosynthesis. - Net Primary Productivity (NPP)- is the addition by makers in energy or biomass per unit region per unit time staying subsequent to considering respiratory misfortunes (R). In an ecosystem, this might be available to customers.
NPP = GPP − R - Secondary Productivity – the biomass gained by heterotrophic organisms, through feeding and absorption, measured in units of mass or energy per unit area per unit time.
- Gross Secondary Productivity (GSP)- is the total energy or biomass assimilated by consumers and is calculated by subtracting the mass of faecal loss from the mass of food consumed. GSP is the total energy gained through absorption in consumers.
GSP = food eaten − faecal loss - Net Secondary Productivity (NSP)is calculated by subtracting the GSP’s respiratory losses (R):
GSP – R = NSP - Net Secondary Production (NSP)- is the gain by consumers in energy or biomass per unit area per unit period left after permitting for respiratory losses (R).
NSP = GSP – R
- Gross Secondary Productivity (GSP)- is the total energy or biomass assimilated by consumers and is calculated by subtracting the mass of faecal loss from the mass of food consumed. GSP is the total energy gained through absorption in consumers.
2.3.4 Cycles
Carbon Cycle
Transfers in the Carbon Cycle | Transformations in the Carbon |
|
|
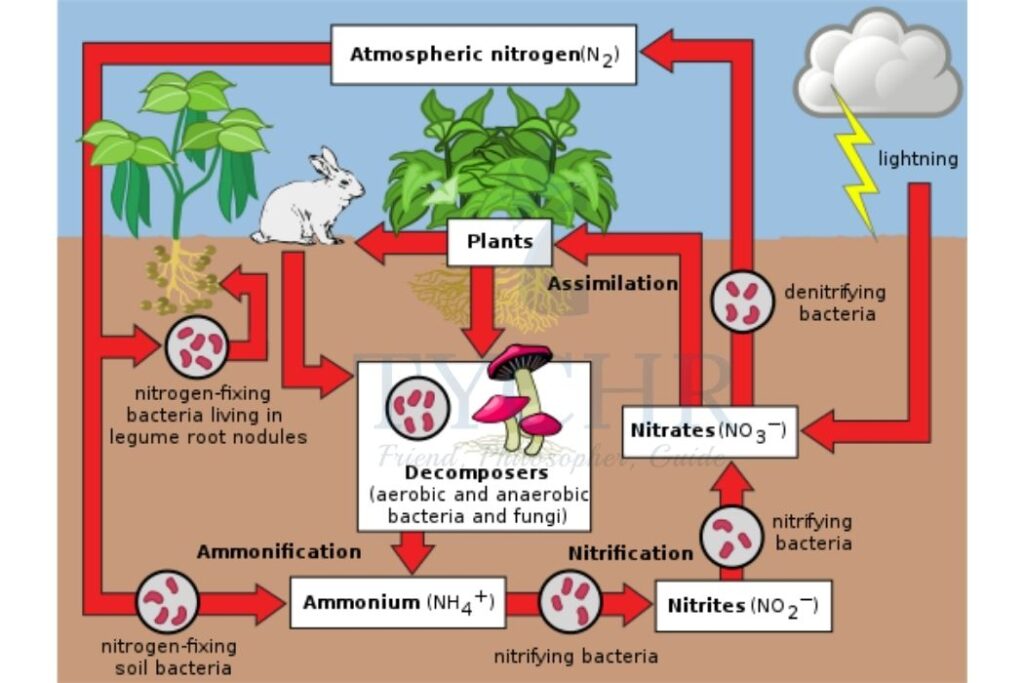
Nitrogen Cycle
2.3.5 The Impact of Human Activities on Energy Flows and Matter Cycles
Energy Flows | Matter Cycles |
|
|
2.4 Biomes, Zonation, and Succession
2.4.1 Biomes
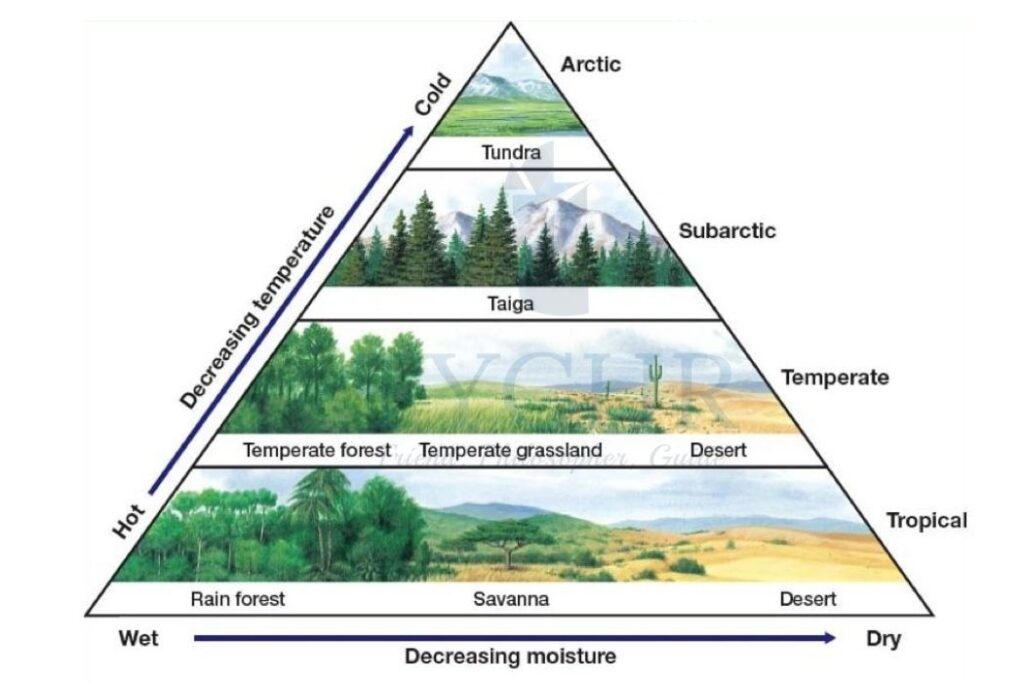
Biome Distribution
Biome distribution depends on levels of insolation (sunlight), temperature and precipitation (rainfall). Some key factors that also affect biome distribution:
- Distribution
- Structure
- Relative Productivity
2.4.2 Zonation
Zonation refers to changes in communities in space, along an environmental gradient. Altitude, latitude, tidal level, and distance from the shore are all factors that contribute to zoning. An example of zonation is the rocky shore which can be divided into zones from the lower to upper shore. Seaweeds show distinct zonation patterns.
2.4.3 Succession
Succession happens when species change the habitat they have colonised and make it more suitable for new species. Succession causes changes in the biotic and abiotic conditions:
- It increases levels of vegetation.
- It causes an increase in soil aeration.
- Decaying vegetation improves the soil fertility.
- The soil & vegetation provide habitats for other organisms.
- This leads to increased biodiversity.

Climax Community
In a climax community there are continuing inputs and outputs of matter and energy, but the system as a whole remains in a more or less constant state (steady-state equilibrium).
Features: Better soil structure, more species diversity, better soil conditions, and increased biomass
2.4.4 R- and K-strategist species
Species can be classified as r-strategist or K-strategist.
R Strategist | K strategist |
|
|
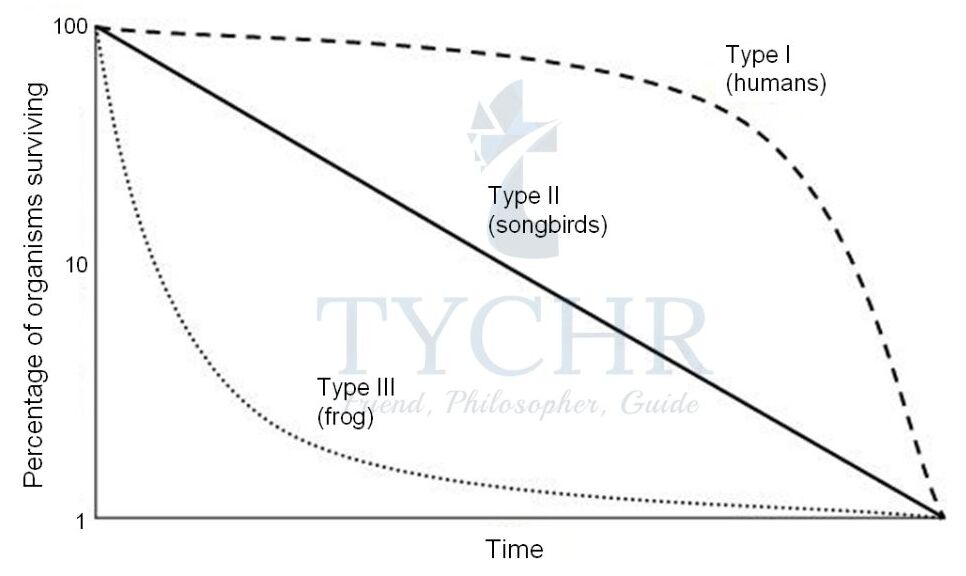
Figure: Survivorship curves for different types of species. Factors that influence survivorship rates include:
- Competition for resources
- Reproductive strategy
- Adverse environmental conditions
- Predator–prey relationships.
2.4.4 The Effect of Climate Change on Biome Distribution
The distribution of biomes is controlled by a combination of temperature, insolation, and precipitation. Increases in carbon dioxide and other greenhouse gases lead to an increase in mean global temperature which in turn affects rainfall patterns. These changes in climate affect the distribution of biomes.
2.4.5 The Impact of Human Activities on Succession
Human Factors Affecting Climatic and Edaphic Factors
The characteristics of a climax community are determined by climate and edaphic (relating to soil) factors. This process is frequently disrupted by human factors. A different stable state, rather than the climax community, is reached as a result of the interference or disturbance, which stops and redirects the succession process. Plagioclimax refers to this abrupt sequence. For instance, the effect of persistent foot traffic on footpath erosion.
2.5 Investigating Ecosystems
2.5.1 Organisms in Ecosystems
A dichotomous key is a handy tool for identification of organisms that one is not familiar with. Dichotomous means ‘divided into two parts’. The key is written so that identification is done in steps. At each step, one has a choice of two options, based on different possible characteristics of the organism one is looking at.
2.5.2 Measuring Abiotic & Biotic Components of the Ecosystem
Measuring Abiotic Factors | Measuring Biotic Factors |
Ecosystems can be divided into three types: marine, freshwater, and terrestrial.
| Quadrats: Biotic factors can be measured using quadrats. Quadrats can be used to measure percentage cover, population density and percentage frequency. 𝑇𝑜𝑡𝑎𝑙 𝑁𝑢𝑚𝑏𝑒𝑟 𝑜𝑓 𝑎 𝑠𝑝𝑒𝑐𝑖𝑒𝑠 𝑖𝑛 𝑎𝑙𝑙 𝑞𝑢𝑎𝑑𝑟𝑎𝑡𝑠 |
2.5.3 Ways for removing an estimate of the Biomass of Trophic Levels
The sample of the organism whose biomass is being determined is weighed in a container of known mass. The sample is put in a hot oven at around 80°C and left for a specific length of time. The sample is reweighed and replaced in the oven. This is repeated until the same mass is obtained on two subsequent weigh-ins; no further loss in mass is recorded, as no further water is present. To estimate the biomass of a primary producer within a study area the following is done:
- All the vegetation is collected within a series of quadrats. The vegetation includes roots, stems and leaves.
- Dry biomass measurements of sample areas are extrapolated to estimate total biomass over the whole area being considered by the study.
- The mass of one organism, or the average mass of several organisms, is taken.
o This mass is multiplied by the total number of organisms to estimate total biomass
2.5.4 Species Richness and Diversity
Two factors are taken into consideration when assessing species diversity: the variety of species and the proportion of individuals belonging to each species.
Simpson’s diversity index- 𝐷 = (N(N-1)/Σ𝑛(𝑛−1))
Where D = diversity index, N = no of species found in total, n = number of individuals of a particular species.
2.5.5 Measuring Changes in Ecosystems
There are a variety of methods you can use to study the effect of human activities:
- Carry out capture–mark–release–recapture methods on invertebrate species in disturbed and undisturbed sites.
- Measure species diversity using the Simpson’s index.
- Use indicator species.
- Measure variables such as light levels, temperature and wind speed. One can also calculate the average width of tree stems at breast height and the degree of canopy openness which would give measures of tree biomass and leaf cover.
- Measuring soil erosion – in areas with high precipitation this can be simply calculated by measuring the depth of soil remaining under free-standing rocks and stones, where soil around these solid objects has been eroded away.
- Measure soil variables such as soil structure, nutrient content, pH, compaction levels, and soil moisture.