BASIC DEFINITIONS AND CONCEPTS
- Probability– Probability concerns numerical descriptions of how likely an event is to occur or how likely it is that a proposition is true. The probability of an event is a number between 0 and 1, where, 0 indicates impossibility of the event and 1 indicates certainty.
- Theoritical approach-To find the probability of an event using theoretical probability, it is not required to conduct an experiment. Instead of that, we should know about the situation to find the probability of an event occurring.
- Experimental approach– The experimental probability also is known as an empirical probability, is an approach that relies upon actual experiments and adequate recordings of occurrence of certain events.
- In experimental probablity, the probability of an event is based on what has actually happened by conducting a series of actual experiments, while in theoretical approach; we attempt to predict what will occur without actually performing the experiments.
- Sample space– The set of all the possible outcomes is called the sample space of the experiment and is usually denoted by 𝑈.
- The probability of an event A is the number of ways event A can occur divided by the total number of possible outcomes.
𝑷(𝑨) = 𝒏(𝑨)/𝒏(𝑼) - A random experiment is an experiment where there is uncertainty concerning which of two or more possile outcomes will result.
- An event is an outcome or a set of outcomes of a random experiment. An event can also be defined as a subset of sample space.
- All possible outcomes together must have probablity 1. The probablity of the sample space is 1. P(𝑈) = 1.
- In frequency theory, probablity is the limit of the relative frequency with which an event occurs in repeated trials. According to this theory- if the probablity that A occurs is p%, means if you repeat the experiment again and again the percentage of time that A occurs will converge to p.
RANDOMNESS
Probablity is the study of randomness and uncertainty. Take an example of throwing an unbiased coin.
If we knew more about the:
- force I flipped the coin with
- the initial orientation of the coin
- the impact point between my finger and the coin
- the turbulence in the air
- the surface smoothness of the table the coin lands on
- the material characteristics of the coin and the table, and so on,
we would be able to definitively say whether the coin would come up heads or tails. However, in the absence of all that information, we cannot predict the outcome of the coin flip.
When we say that something is random, we are saying that our knowledge about the outcome is limited, so we can’t be certain what will happen.
The probability of an outcome is interpreted as the long-run proportion of the time that the outcome would occur, if the experiment were repeated indefinitely. That is, probability is long-term relative frequency.
Ex. Construct a sample space for the experiment that consists of rolling a single die. Find the events that correspond to the phrases “an even number is rolled” and “a number greater than two is rolled.”
The outcomes could be labeled according to the number of dots on the top face of the die. Then the sample space is the set S={1,2,3,4,5,6}.
The outcomes that are even are 2, 4, and 6, so the event that corresponds to the phrase “an even number is rolled” is the set {2,4,6}, which it is natural to denote by the letter E. We write E={2,4,6}.
Similarly the event that corresponds to the phrase “a number greater than two is rolled” is the set T={3,4,5,6}, which we have denoted T.
VENN DIAGRAMS, TREE DIAGRAMS AND GRIDS
VENN DIAGRAMS
- A Venn diagram is an illustration that uses circles to show the relationships among sets.
- It is made of circles or closed curves within an enclosing rectangle (the universal set)
- Circles that overlap have a commonality while circles that do not overlap do not share those traits.
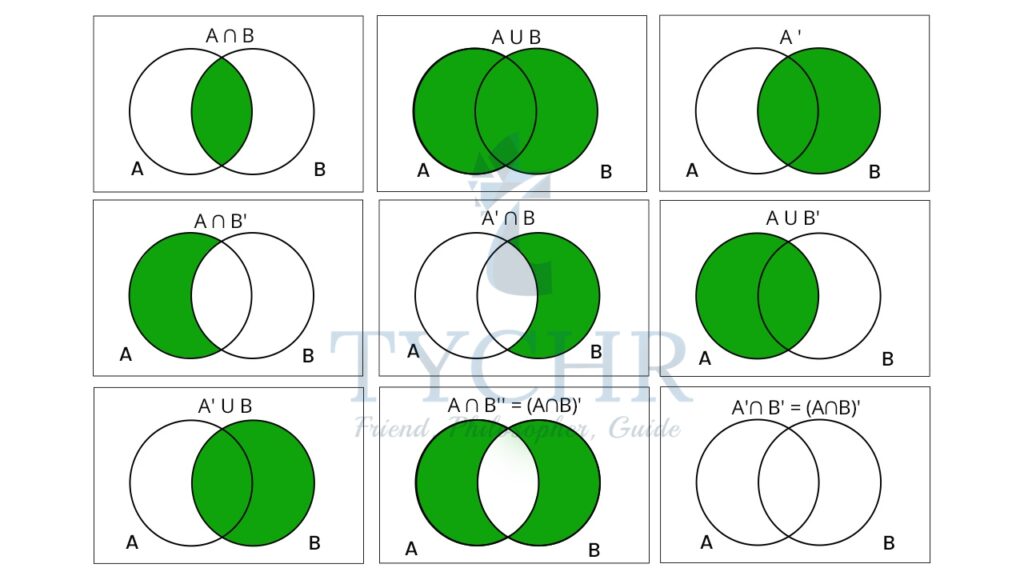
- 𝑈 – Union (or). The union of two sets contains all the elements contained in either set (or both sets).
- ∩ Intersection (and). The intersection of two sets contains only the elements that are in both sets.
- 𝐴𝑐 𝑜𝑟 𝐴′ The complement of a set A contains everything that is not in the set A.
Let’s solve a problem using logic and not the formulas:
Ex. In a class of 50 students, 30 take philosophy, 23 take sociology and 12 take both. What is the probablity that a randomly selected student-
- Takes sociology
- Takes both philosophy and sociology
- Does not take philosophy
- Takes sociology but not philosophy
- Takes philosophy or sociology
- Takes neither philosophy nor sociology
- Takes sociology or philosophy but not both.
Making a venn diagram for the given data:
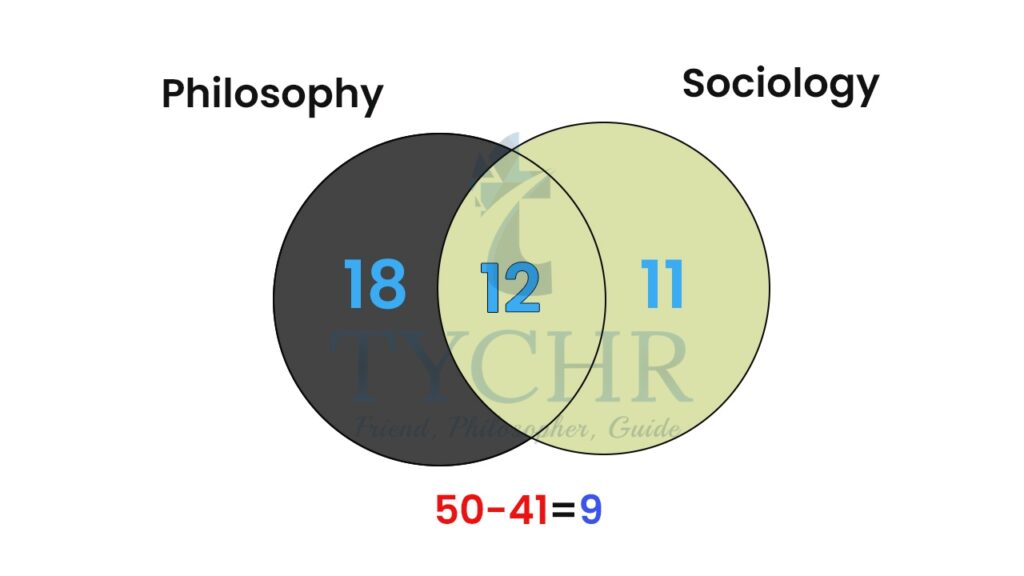
30 take philosophy and 12 take both, so the ones who only take philosophy will be 30-12 i.e. 18, as represented in the venn diagram. Similarly, the ones who take only sociology will be 11.
The total students who take subjects are -18+12+11= 41, which means 9 are left.
- Probability of taking sociology = 𝑆𝑡𝑢𝑑𝑒𝑛𝑡𝑠 𝑤ℎ𝑜 𝑡𝑜𝑜𝑘 𝑠𝑜𝑐𝑖𝑜𝑙𝑜𝑔𝑦/𝑇𝑜𝑡𝑎𝑙 𝑠𝑡𝑢𝑑𝑒𝑛𝑡𝑠 = 23/50 = 𝟎. 𝟒𝟔
- Probability of taking both = 𝐼𝑛𝑡𝑒𝑟𝑠𝑒𝑐𝑡𝑖𝑜𝑛 𝑜𝑓 𝑏𝑜𝑡ℎ 𝑠𝑢𝑏𝑗𝑒𝑐𝑡𝑠/𝑇𝑜𝑡𝑎𝑙 𝑠𝑡𝑢𝑑𝑒𝑛𝑡𝑠 = 12/50 = 0.24
- Probability of not taking philosophy = 1- Probability of taking philosophy
= 1 − (𝑆𝑡𝑢𝑑𝑒𝑛𝑡𝑠 𝑤ℎ𝑜 𝑡𝑜𝑜𝑘 𝑝ℎ𝑖𝑙𝑜𝑠𝑜𝑝ℎ𝑦 /𝑇𝑜𝑡𝑎𝑙 𝑠𝑡𝑢𝑑𝑒𝑛𝑡𝑠 )= 1 − (30/50) = 0.4 - Probability of sociology but not philosophy = 𝑆𝑡𝑢𝑑𝑒𝑛𝑡𝑠 𝑡𝑎𝑘𝑖𝑛𝑔 𝑜𝑛𝑙𝑦 𝑠𝑜𝑐𝑖𝑜𝑙𝑜𝑔𝑦/𝑇𝑜𝑡𝑎𝑙 𝑠𝑡𝑢𝑑𝑒𝑛𝑡𝑠 = 11/50 = 0.22
- Probability of philosophy or sociologyUnion of the events= (18+12+11)/50 = 0.82
- Probability of neither philosophy nor sociology = 𝑆𝑡𝑢𝑑𝑒𝑛𝑡𝑠 𝑤ℎ𝑜 𝑡𝑎𝑘𝑒 𝑛𝑜𝑛𝑒 𝑜𝑓 𝑡ℎ𝑒 𝑠𝑢𝑏𝑗𝑒𝑐𝑡𝑠/𝑇𝑜𝑡𝑎𝑙 𝑠𝑡𝑢𝑑𝑒𝑛𝑡𝑠 = 9/50 = 0.18
- Probability of sociology or philosophy but not both = 𝑆𝑡𝑢𝑑𝑒𝑛𝑡𝑠 𝑡𝑎𝑘𝑖𝑛𝑔 𝑒𝑖𝑡ℎ𝑒𝑟 𝑠𝑢𝑏𝑗𝑒𝑐𝑡𝑠 𝑏𝑢𝑡 𝑛𝑜𝑡 𝑏𝑜𝑡ℎ/𝑇𝑜𝑡𝑎𝑙 𝑠𝑡𝑢𝑑𝑒𝑛𝑡𝑠 = (18+11)/50 = 0.58
ADDITION RULE
When taking union of 2 sets, adding them directly will cause an error. By adding the sets directly we include the intersection twice, therefore we must subtract the intersection once.
The addition rule states:
𝑃(𝐴 ∪ 𝐵) = 𝑃(𝐴) + 𝑃(𝐵) − 𝑃(𝐴 ∩ 𝐵)
It is illustrated in the venn diagram below: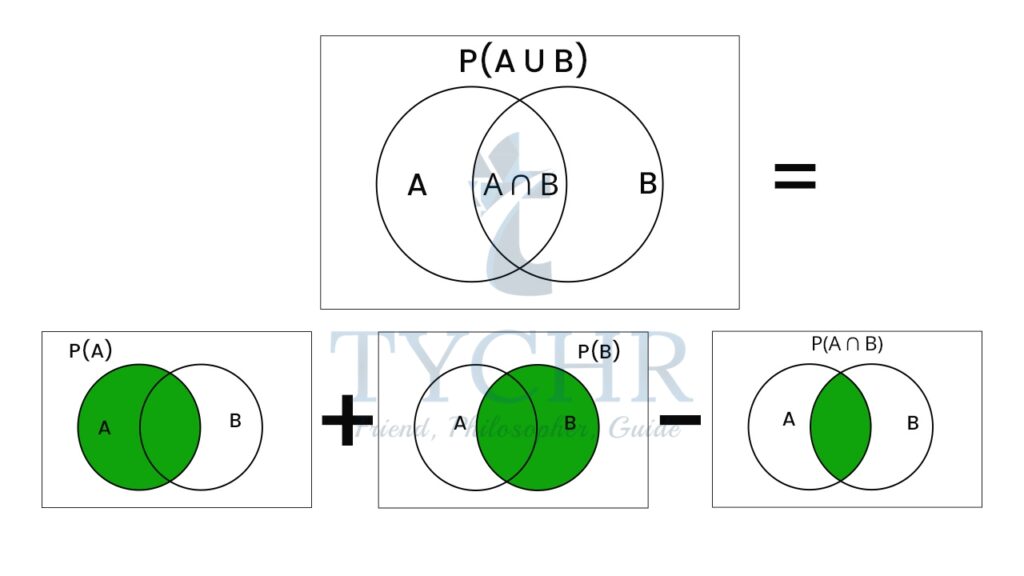
Ex. A single card is chosen at random from a standard deck of 52 playing cards. What is the probability of choosing a king or a club?
𝑃(𝐴 ∪ 𝐵) = 𝑃(𝐴) + 𝑃(𝐵) − 𝑃(𝐴 ∩ 𝐵)
𝑃(𝑘𝑖𝑛𝑔 𝑜𝑟 𝑐𝑙𝑢𝑏) = 𝑃(𝑘𝑖𝑛𝑔) + 𝑃(𝑐𝑙𝑢𝑏) − 𝑃(𝑘𝑖𝑛𝑔 𝑜𝑓 𝑐𝑙𝑢𝑏𝑠) = ((4/52) + (13/52) − (1/52)) = 16/52 = 4/13
TREE DIAGRAMS, TABLES AND GRIDS
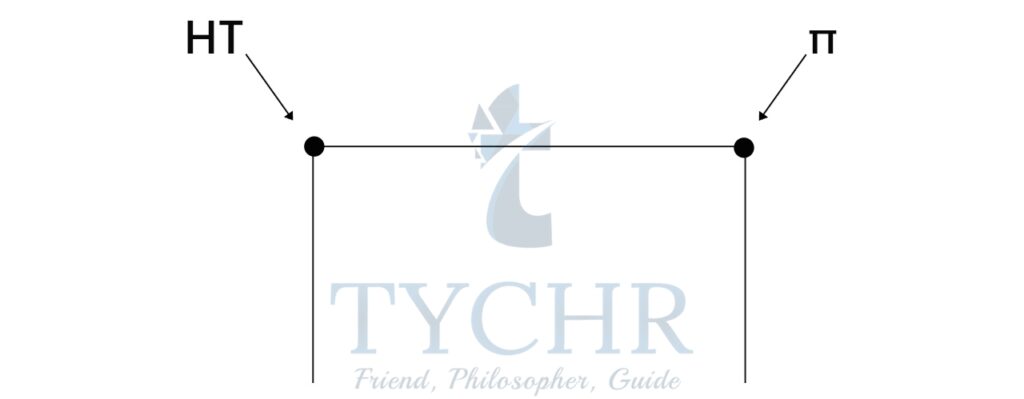
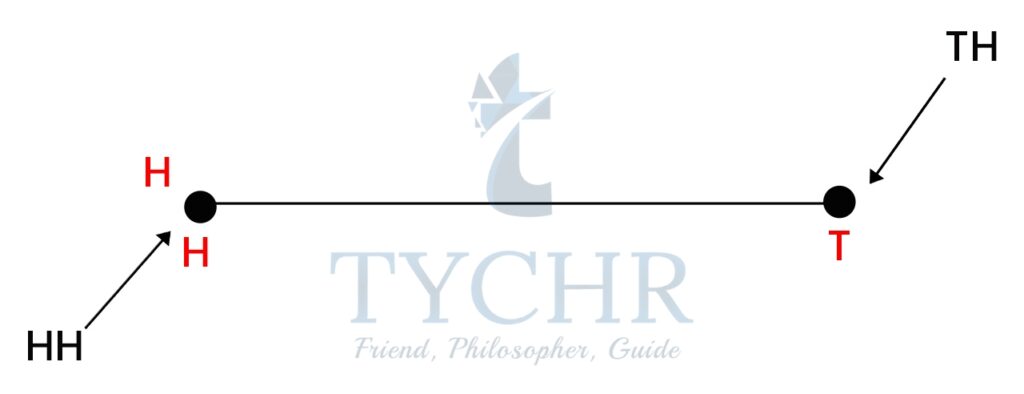
If you flip a coin twice, you can model the possible outcomes using a tree diagram or an outcome table.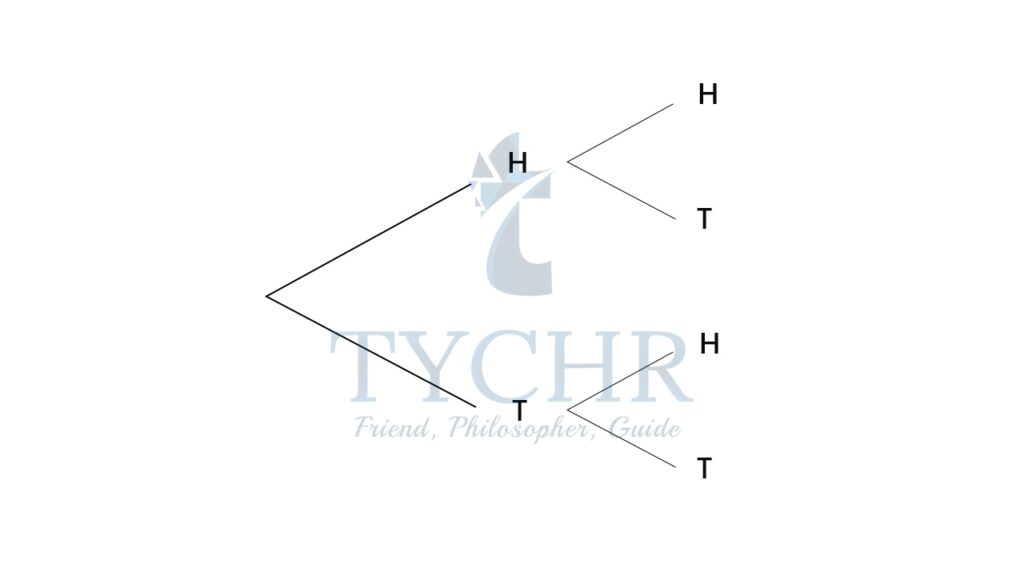
Outcome table:
Flip1 | Flip 2 | Event |
H | H | HH |
H | T | HT |
T | H | TH |
T | T | TT |
We can also show this using a 2-D grid:
PROBABILITY ASSIGNMENTS
MUTUALLY EXCLUSIVE EVENTS
Mutually exclusive (or disjoint) events are events whose outcomes cannot occur at the same time.
Ex. (a) Turning left and turning right are Mutually Exclusive (you can’t do both at the same time)
(b) Tossing a coin: Heads and Tails are Mutually Exclusive
(c) Cards: Kings and Aces are Mutually Exclusive
The events which cannot be mutually exclusive:
Ex. (a) Turning left and scratching your head can happen at the same time
(b) Kings and Hearts, because we can have a King of Hearts!
When two events (call them “A” and “B”) are Mutually Exclusive it is impossible for them to happen together, which implies the intersection of these events is zero.𝑃(𝐴 ∩ 𝐵) = 0 From addition rule –
𝑃(𝐴 ∪ 𝐵) = 𝑃(𝐴) + 𝑃(𝐵) − 𝑃(𝐴 ∩ 𝐵)
For mutually exclusive events-
𝑃(𝐴 ∪ 𝐵) = 𝑃(𝐴) + 𝑃(𝐵)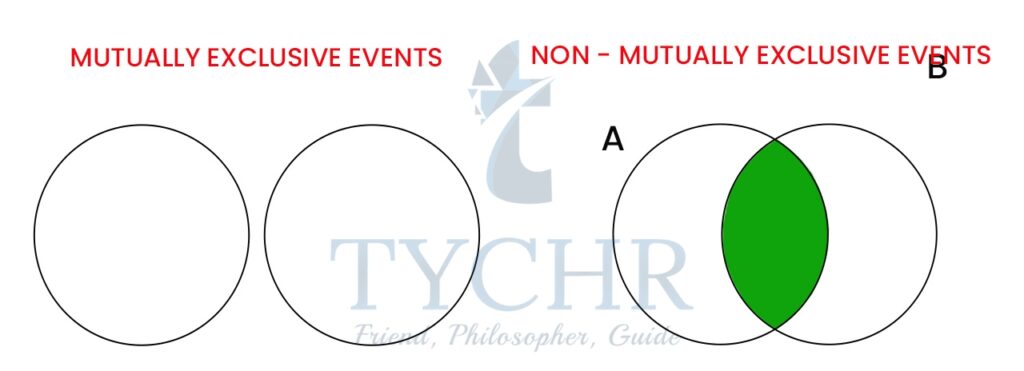
Ex. If the probability of:
scoring no goals (Event “A”) is 20%
scoring exactly 1 goal (Event “B”) is 15%
Find the probablity of scoring no goals or 1 goal
The probability of scoring no goals and 1 goal is 0 (Impossible)
The probability of scoring no goals or 1 goal is 20% + 15% = 35%
Can be written as 𝑃(𝐴 ∪ 𝐵) = 𝑃(𝐴) + 𝑃(𝐵) (mutually exclusive events) 𝑃(𝐴 ∪ 𝐵) = 20% + 15% = 35% The probablity of scoring no goals or 1 goal is 35%.
EQUALLY LIKELY OUTCOMES
When the likelihood of happening of two events are same they are known as equally likely events. Example-
- If we toss a coin, there are equal chances of getting a head or a tail. Hence, getting a head or a tail by tossing a coin are equally likely events.
- When you roll a fair die, you are equally likely to roll a 1, 2, 3, 4, 5, or 6.
Ex. In the experiment of throwing a die, where
G: the event of getting a prime number
H: the event of getting an even number
Probability of 𝐺 = 1/2
Probability of H = 1/2
The two events G and H are equally likely.
But they are not mutually exclusive since both events occur when 2 apperas on the die.
GEOMETRIC PROBABILITY
Some problems may require the need to geometry (areas in plane) to solve.
Ex Find the probability that a randomly chosen point in the figure lies in the shaded region.
Total area = 𝜋(5)2 = 25𝜋
Area of shaded region = 𝜋(5)2 − 𝜋(5 − 3)2 = 21𝜋
Required probability = 𝐴𝑟𝑒𝑎 𝑜𝑓 𝑠ℎ𝑎𝑑𝑒𝑑 𝑟𝑒𝑔𝑖𝑜𝑛/𝑇𝑜𝑡𝑎𝑙 𝑎𝑟𝑒𝑎 = 21𝜋/25𝜋 = 0.84
PROBABILITY CALCULATIONS USING COUNTING PRINCIPLES
Ex. A store has six different fitness magazines and three different news magazines. If a customer buys three magazines at random, find the probability that the customer will pick two fitness magazines and one news magazine.
There are 26C or 15 ways to select two fitness magazines from six fitness magazines.
26C 6!/(6−2)!2! = 6!/4!2! = 15
There are 13C or three ways to select one magazine from three news magazines.
13𝐶 = 3!/(3−1)!1! = 3!/2!1! = 3
Using fundamental counting principle, there are 15×3 or 45 ways to select two fitness magazines and one news magazine.
INDEPENDENT AND DEPENDENT EVENTS AND CONDITIONAL PROBABILITY
DEPENDENT AND INDEPENDENT EVENTS
- Dependent Events are where what happens depends on what happened before, such as taking cards from a deck makes less cards each time
- Two events A and B are independent if the occurrence of one does not affect the chance that the other occurs. Ex. A coin does not “know” it came up heads before. Each toss of a coin is a perfect isolated thing.
- We can calculate the chances of two or more independent events by multiplying the chances.
- If A and B are independent events, then 𝑷(𝑨 ∩ 𝑩) = 𝑷(𝑨) × 𝑷(𝑩).
This is called the multiplication rule or product rule for independent events.
Ex. Probability of 3 Heads in a Row For each toss of a coin a Head has a probability of 0.5 And so the chance of getting 3 Heads in a row is 0.125.
Ex. Your boss (to be fair) randomly assigns everyone an extra 2 hours work on weekend evenings between 4 and midnight.
What are the chances you get Saturday between 4 and 6?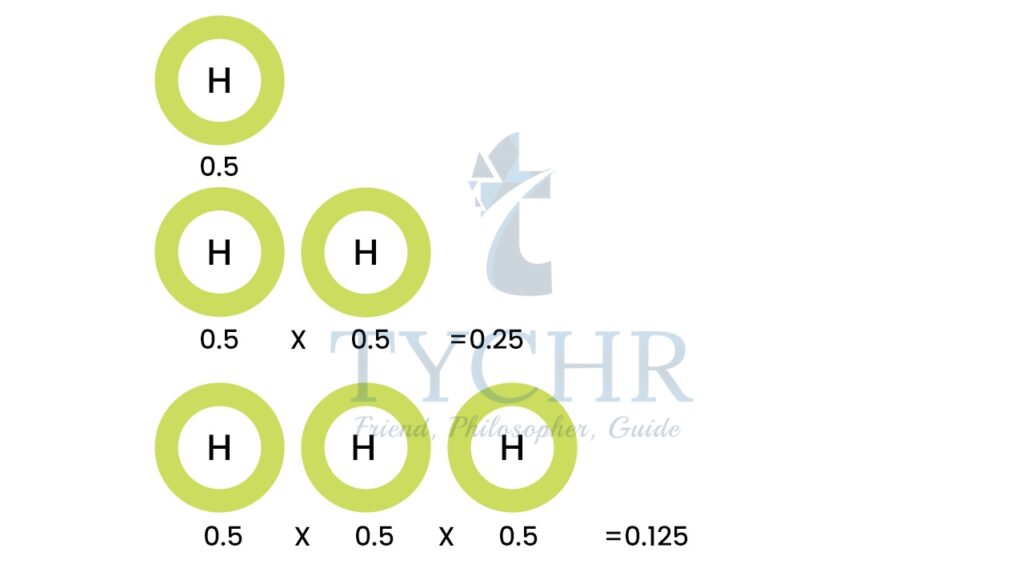
Day: there are two days on the weekend, so P(Saturday) = 0.5
Time: you want the 2 hours of “4 to 6”, out of the 8 hours of 4 to midnight: P(“4 to 6”) 2/8 0.25
P(Saturday and “4 to 6”) P(Saturday) P(“4 to 6”)
=0.5×0.25
=0.125
Or a 12.5% Chance.
CONDITIONAL PROBABILITY
- 𝑃(𝐴|𝐵) is known as conditional probability. We say the probability of A given B.
Ex. We have 2 blue marbles and 3 red marbles. What are the chances of drawing out 2 blue marbles.
Let’s draw a tree diagram we learnt in previous section.
There is a 2/5 chance of pulling out a Blue marble, and a 3/5 chance for Red:
We can go one step further and see what happens when we pick a second marble: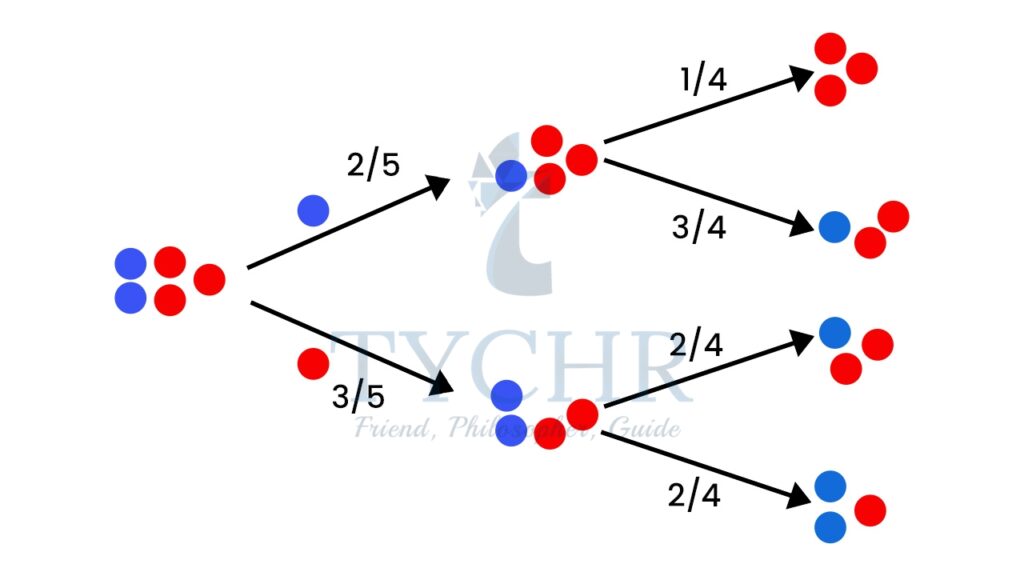
It is a 2/5 chance followed by a 1/4 chance of drawing out a blue marble ((2/5) x (1/4)) = 1/10
Notation:
In our marbles example Event A is “get a Blue Marble first” with a probability of 2/5:
P(A) = 2/5
And Event B is “get a Blue Marble second” … but for that we have 2 choices:
- If we got a Blue Marble first the chance is now 1/4
- If we got a Red Marble first the chance is now 2/4
P(B|A) (conditional probability) means “Event B given Event A”
In other words, event A has already happened, now what is the chance of event B?
And in our case: P(A) = 1/4 So the probability of getting 2 blue marbles is: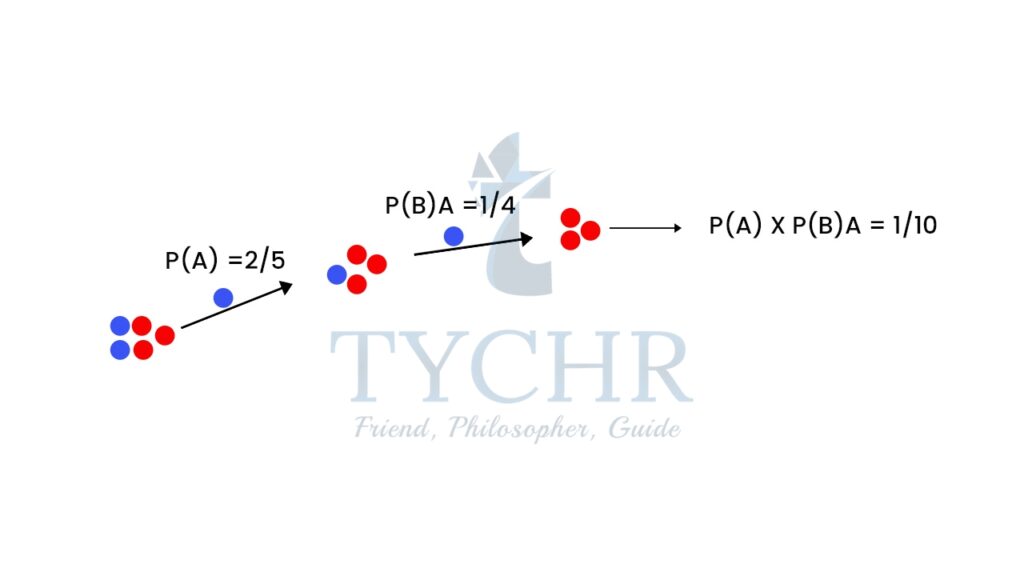
And we write it as:
𝑃(𝐴 𝑎𝑛𝑑 𝐵) = 𝑃(𝐴) × 𝑃(𝐵|𝐴)
𝑃(𝐴 𝑎𝑛𝑑 𝐵) = 𝑃(𝐵) × 𝑃(𝐴|𝐵)
or we can write it as:
𝑷(𝑨 ∩ 𝑩) = 𝑷(𝑨) × 𝑷(𝑩|𝑨)
𝑷(𝑨 ∩ 𝑩) = 𝑷(𝑩) × 𝑷(𝑨|𝑩)
We know that for independent events 𝑃(𝐴 ∩ 𝐵) = 𝑃(𝐴) × 𝑃(𝐵) Therefore,
𝑃(𝐵|𝐴) = 𝑃(𝐵)
𝑃(𝐴|𝐵′ ) = 𝑃(𝐴)
𝑃(𝐵|𝐴′ ) = 𝑃(𝐵)