A. EQUATIONS AND FORMULAE
- Equation- A statement equating two algebraic expressions.
- Solution or Roots- The value(s) substituted for the variables(s) for which the equation holds true.
- Solution set- A set comprises of all of the solutions to an equation.
- Identity- An equation that is true for all possible values of the variable
- Formula- Many equations are referred to as a formula, comprising of one or more variables and other symbols that represent constants.
I. EQUATIONS AND GRAPH
In this Chapter we will only discuss equations with algebraic expressions that are polynomial.
For polynomials in one variable, the solution consists of individual numbers, so we plot them on a number line.
Ex. x2-2x-8=0, has two solutions -2 and 4. Plotting them on number line:

The solution of a 2-variable equation will be an ordered pair of numbers i.e. a location indicated by a point on 2-dimentional coordinate system (coordinate plane). Ex. the solution set of y=x2 will be infinite set of ordered pairs (x,y) that satisfy the equation.

II. EQUATIONS OF LINES
A one variable linear equation in x can be written in the form ax+b=0, a≠0, and we will have exactly one solution, x=-(b/a).
There are several forms for writing linear equations
| General form | ax+by+c=0 | A line can be written in this form if a,b≠0 |
| Slope-Intercept form | y=mx+c | m is the slope and (0,c) is the y-intercept |
| Point-slope form | y-y1=m(x-x1) | (x1,y1) is a point on the line |
| Horizontal line | y=c | Slope is zero, (0,c) is the y-intercept |
| Vertical line | x=c | Slope is undefined, no y-intercept |
𝑚 = (𝑉𝑒𝑟𝑡𝑖𝑐𝑎𝑙 𝑐ℎ𝑎𝑛𝑔𝑒/𝐻𝑜𝑟𝑖𝑧𝑜𝑛𝑡𝑎𝑙 𝑐ℎ𝑎𝑛𝑔𝑒) =(𝑦2 − 𝑦1)/(𝑥2 − 𝑥1)
(x1,y1) and (x2,y2) are any two points on the line.
Ex. Find the slope and equation of a line passing through (2,4) and (1,3). Also sketch the graph of the line.
m=(𝑦2 − 𝑦1)/(𝑥2 − 𝑥1)
m = (4-3)/(2-1)
m=1
Using point slope form of line:
y-y1=m(x-x1)
y-3=1(x-1)
y=x+2
Taking the given 2 points on the graph and joining them to obtain a graph:

The slope of a line is a convenient tool for determining if the given two line are parallel or perpendicular.
Let m1 and m2 be slopes of two lines, then:
- The lines are parallel if, m1=m2
- The lines are perpendicular if m1m2=1.
Ex. y=3x+4 and y=3x-2 are parallel lines (m1=m2=3), which can also be seen in the graph:

Ex. y=x+2 and y=-x-1 are perpendicular line (m1m2=-1), which can also be seen in the graph:
Ex. Find the equation of the following graph:

Taking slope-intercept form: y=mx+c
Clearly from the graph, the y-intercept is 3. Therefore c=3
The graph passes through (0,3) and (-3,-3)
The slope becomes: m = (3-(-3))/(0-(-3))
m = 6/3
m=2
Therefore, the equation becomes- y=2x+3
Ex. Find the equation of a line with y-intercept (0,-4) that is perpendicular to the line with equation y = -(7/2)x + 6
Taking slope-intercept form: y=mx+c
Given that y-intercept is -4, So c=-4
The given equation of line has slope = -(7/2)
And this line is perpendicular to the required line, therefore: The equation of the required line becomes: y = -(7/2)x + 6
III. DISTANCES AND MIDPOINTS
On a number line, the absolute value of difference between any two numbers is used to define the distance between those two points.
We can find the distance between any two points (x1,y1) and (x2,y2) on a coordinate plane using distance formula. If d represents the distance between the points (x1,y1) and (x2,y2), then:

This can be understood by applying Pythagoras’ theorem to triangle ABC, in the given graph.
AB=d
AC=y1-y2
BC=x1-x2
AB2 = BC2 + AC2

The coordinates of the midpoint of the line segment joining the points (x1,y1) and (x2,y2) in the coordinate plane is: ((x1-x2)/2 , (y1-y2)/2)
B. DEFINITION OF FUNCTION
A function from x (independent variable) to y (dependent variable) is a relation f between x and y in such a way that for a specific value of x, a single value of y is determined. Then we write, y=f(x). (Reads y equals f of x)
Think of a function like a machine. If we put in one value of x, we want one value of y to come out each time.
Useful ways of representing a function include a graph of the equation, a table, a set of ordered pairs or a mapping.
A function can be a one-to-one mapping or a many-to-one mapping:
Ex. y2=x, here, for x=1, y can have two values, i.e. 1 and -1. Hence, it is not a function.
To check if a relation is a function or not graphically, we draw a vertical line on the graph and check how many times the line cuts the graph.
If the line cuts the graph only once, then the given relation is a function.
This is known as the vertical line test.
Given below, the line cuts the graph y2=x twice. So, the given equation is not a function

I. DOMAIN AND RANGE OF A FUNCTION
The domain of a function is the set of all real numbers for which the given expression is defined as a real number. For example, if a certain value of x is substituted into the algebraic expression defining a function and it causes division by zero or the square root of a negative number to occur, that value of x cannot be in the domain.
Range of a function is determined by analysing the output of the function for all values of input (domain).
In other words, the largest possible set of values for the independent variable (the input set) is called the domain and the set of resulting values for the dependent variable (the output set) is called the range.
A combination of algebraic and graphical analysis is very useful in determining the domain and range of a function.
Ex. Find the domain and range of the following
- Table of values:
x
2
3
4
5
y
4
9
16
25
Domain- {2,3,4,5}
Range- {4,9,16,25} - Mapping Diagram
Domain- {-2,-3,4,5}
Range- {6, 5, 8} - Set of ordered pairs
{(-3,5),(-1,9),(3,5)}
Domain- {-3,-1,3}
Range- {5,9} - Equation
y=x2
Using Algebraic analysis:
Squaring any real number will always produce a real number. Hence, the domain will be all real numbers.Now squaring any real number, whether positive or negative will give us a positive real number only. Hence, the range will be all positive real numbers.
Using Graphical analysis:
The graph stays above x-axis only, i.e. in the region of positive y-axis. Hence, the range will be all positive real numbers.
Domain – xϵ ]-∞,∞[
Range- yϵ [0,∞[

II. FUNCTION NOTATION
A function is named using a single letter, like f,g,h etc. Given that the domain variable is x and the range variable is y, symbol f(x) denotes the unique value of y that is generated by the value of x.
Functional notation is a quick way of expressing substitution. Rather than saying “Given y=4x-19, find the value of y if x=5”, we can simply state: “Given f(x)=4x-19, find f(2)”.
We have two functional notations:
- f(x)=x2 (f of x equals x2)
- f:x→x2 (The function f maps x tox2
Both notations imply the same thing.
Ex. If f(x)=-3x2-1, find:
- f(-1)
- f(0)
- f(x+1)
Solution:
- f(-1) = -3(-1)2 – 1
f(-1)=-3-1
f(-1)=-4 - f(0)=-3(0)-1
f(0)=-3-1
f(0)=-4 - f(x+1) = -3(x+1)2 – 1
f(x+1)=-3(x2+2x+1)-1
f(x+1)=-3x2-6x-3-1
f(x+1)=-3x2-6x-4
C. COMPOSITE FUNCTIONS
I. INTRODUCTION
Let us understand the meaning of composite functions with the help of an example:
Lett 𝑓(𝑥) = √(𝑥 + 4)
This function can be seen as a combination of two functions:
1. 𝑔(𝑥) = √x
2. h(x)=x+4
Now, if we compose the functions g(x) and h(x), in the way as follows: g(h(x)) = g(x+4) = √(x+4) = f(x)
We get f(x)!
Thus, a function that is obtained from simpler functions by applying one after another in a specific way is called a composite function.
g(h(x)) is denoted by (g o h(x)) If the range of h(x) is in the domain of g, then we can compute(g o h(x)).
Ex. If f(x) = 3x and g(x)=2x-6, Find
(a). (f o g)(5)
(b). (g o f)(5)
- (f o g)(5) = f(g(5)) = f (2×5-6) = f(4) = 3×4 = 12
Alternatively:
(f o g)(x)=f(g(x))=f(2x-6)=3(2x-6)=6x-18
Putting x=5
(f o g)(5)=6(5)-18
(f o g)(5)=12 - (g o f)(5)=g(f(5))=g(3×5)=g(15)=2(15)-6=24
Alternatively:
(g o f)(x)=g(f(x))=g(3x)=2(3x)-6=6x-6
Putting x=5
(g o f)(5)=6(5)-6
(g o f)(5)=24
II. DECOMPOSING A COMPOSITE FUNCTION
Understand with the help of examples:
Ex. These functions are of the form (f o g)(x), find the two composite functions f and g.
- When we look at h(x), we first see the expression x+3 and then the fact that it is reciprocated. Hence, the two functions which will compose h(x), will be:
g(x)=x+3 and f(x) = 1/x
To check if our answer is correct, we will find (f og)(x):
(fog)(x)=f(g(x))=f(x)+3=1/(x+3)
(f o g)(x)=h(x)
Hence, our answer is correct.
- Looking at k(x), we see that the there is an expression in the power of 2. We can take one function to be that expression and the other can simply be 2 raised to x.
Hence, the two functions which will compose h(x), will be:
g(x)=4x+1 and f(x)=2x
To check if our answer is correct, we will find (g o f)(x):
(g o f)(x)=g(f(x))=g(2x )=2(4x+1)
(g o f)(x)=k(x)
III. FINDING DOMAIN OF A COMPOSITE FUNCTION
There are two conditions for a value x to be in domain of a composite function, say, (g o h)(x):
- x must be in the domain of h
- h(x) must be in the domain of g
Also, g(f(x)) is the range of g o h only if x is in the domain of g o h.
The domains of g o h and h o g are not the same.
Ex. g(x)=x2-4 and ℎ(𝑥) = √x. Find:
a. (g o h)(x) and its domain and range
b. (h o g)(x) and its domain and range.

 To be in domain of g o f, must be defined for x≥0.
Therefore, the domain of g o f is x ϵ(g o h)(x)=x-4 , and the domain is x≥0, which implies the range of g o h is 

which implies x2-4≥0 or x2≥4
Therefore, the domain of h o g is ]−∞, −2] ∪ [2, ∞[
With x≤-2 and x≥2 and (ℎ 𝑜 𝑔)(𝑥) = √(𝑥2−4),
The range of h o g is 𝑦 𝜖[0, ∞[
This also proves that the domain and range of g o h and h o g is not necessarily same.


D. INVERSE FUNCTIONS
I. PAIRS OF INVERSE FUNCTIONS
When we choose a number, apply an operation on it, say square it and then apply the reverse operation, i.e. take square root or vice versa, we get the same number again!
Consider two functions:
f(x)=x2 and g(x)=√x
Now to write in notations, to square a number and then take its square root:
Now since function g has an inverse effect on function f, we call function g the inverse of the function f. Function f has the same effect on function g, then we can also say that f is the inverse of g.
Understanding the domain and range by means of a mapping diagram for squaring and square root function:
- g(f(x))=x for all x in the domain of f
- f(g(x))=x for all x in the domain of g
To prove these two statements:
In the example taken above, f(x)=x2 and g(x)=√x, both the composite functions came out to be equal to 𝑥, 𝑓 𝑜 𝑔 = 𝑔 𝑜 𝑓 = 𝑥.
Considering the same example, f and g are functions, so by definition, for every number in the domain of f and g, there is exactly one number in its range. Since f and g are a pair of inverse functions, then we can also say that every number in the range of f and g is determines by exactly one number in its domain.
Such functions are called one-to-one functions.
In other words, A function is one-to-one if each element y in the range is the image of exactly one element x in the domain.
To prove if a function is one-to-one graphically, we draw a horizontal line on the graph and check how many times the line cut the graph.
If the line cut the graph exactly once, then the function is one-to-one.
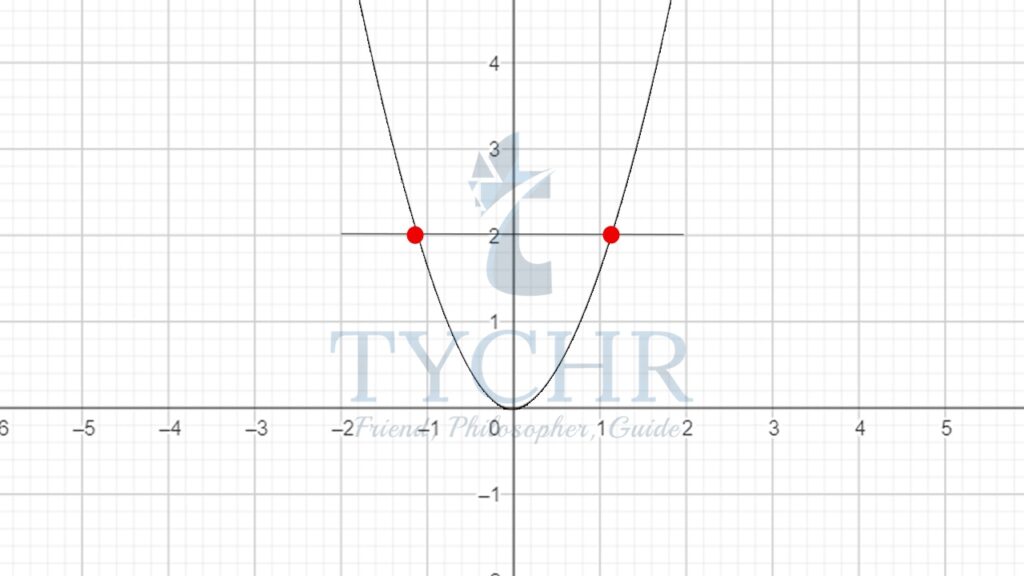
Ex: y=x2
The horizontal line cuts the graph of the function twice. Therefore, the given function is not one-to-one and hence cannot be inverted. Such functions are called many-to-one functions.
II. THE EXISTANCE OF AN INVERSE FUNCTION
The inverse of a function will only exist if the function is one-to-one. Because when a function is inversed, the result must also be a function.
In general, functions which are always increasing or always decreasing, throughout its domain are one-to-one functions.
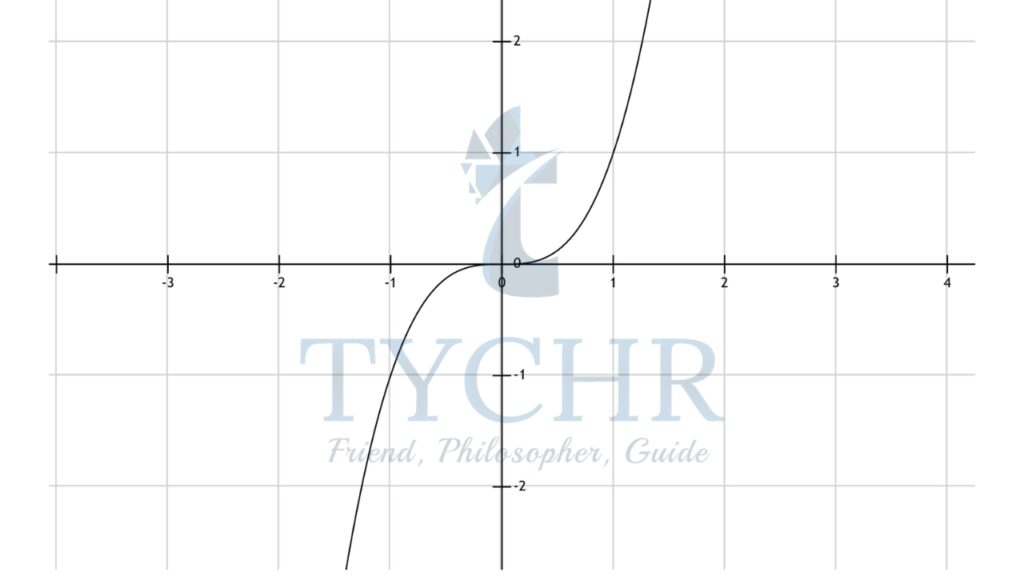
Ex: f(x)=x3. As seen in the graph below, the function is ever increasing and there is no horizontal line which cuts the graph more than once.

The inverse of a many-to-one function will not be a function. Hence, many-to-one functions are not invertible. However, a many-to-one function can be converted into a one-to-one function by restricting its domain.
III. FINDING THE INVERSE OF A FUNCTION
The inverse of a function f is denoted f-1.
The simplest method of finding inverse of a function is to interchange domain (x) and range (y).
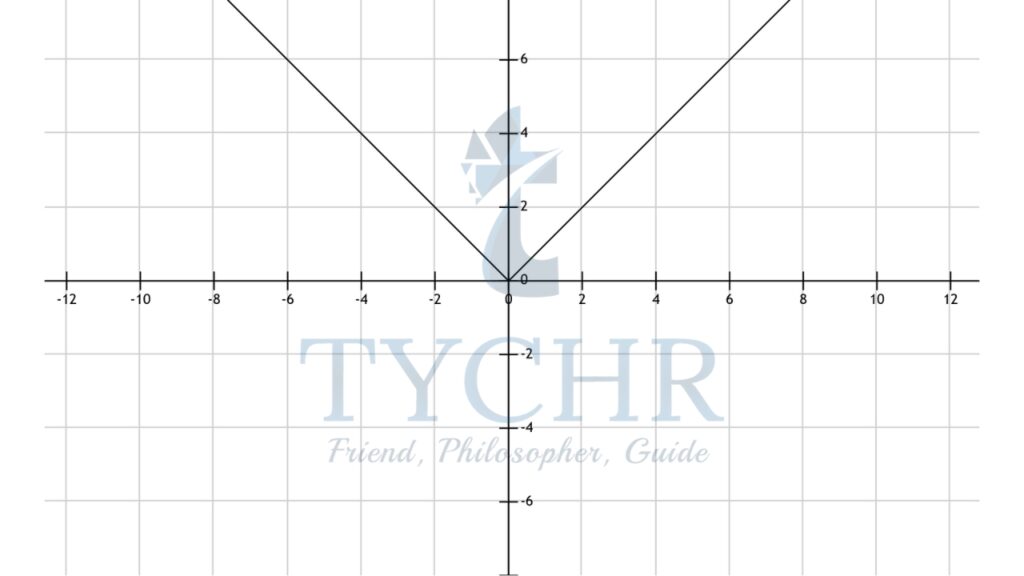
Ex. 𝑓(𝑥) = (√(𝑥 + 2)) − 3, Check if f(x) is invertible, if yes then find f-1
Checking graphically, if the given function is one-to-one:
Clearly, no horizontal line cuts the graph twice. Therefore, the givenfunction is invertible Finding the inverse: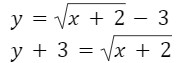
Squaring both sides:
Now interchanging x and y:
y = (x+3)2 -2y
Therefore,
f-1(x) = (x+3)2 -2
E. TRANSFORMATION OF FUNCTIONS
I. GRAPHS OF COMMON FUNCTIONS
Following are some basic graphs to keep in mind:
- f(x)=c
- f(x)=x
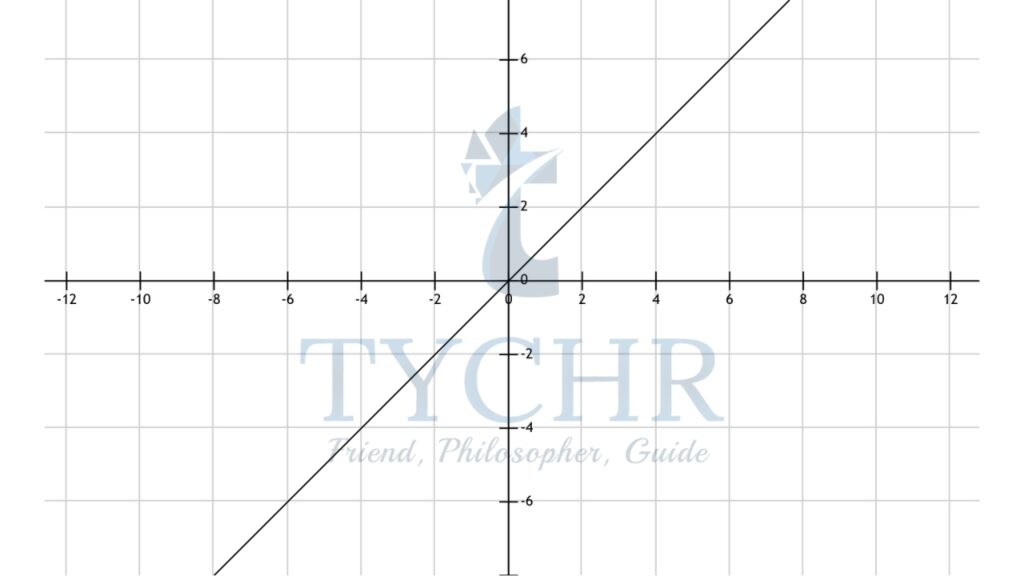
- f(x)=|x|
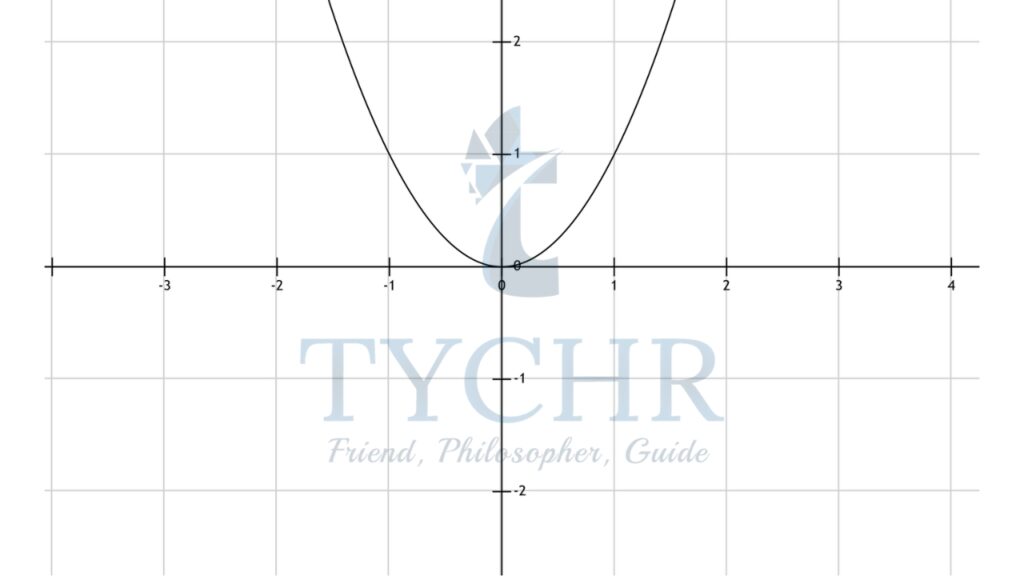
- f(x)=x2
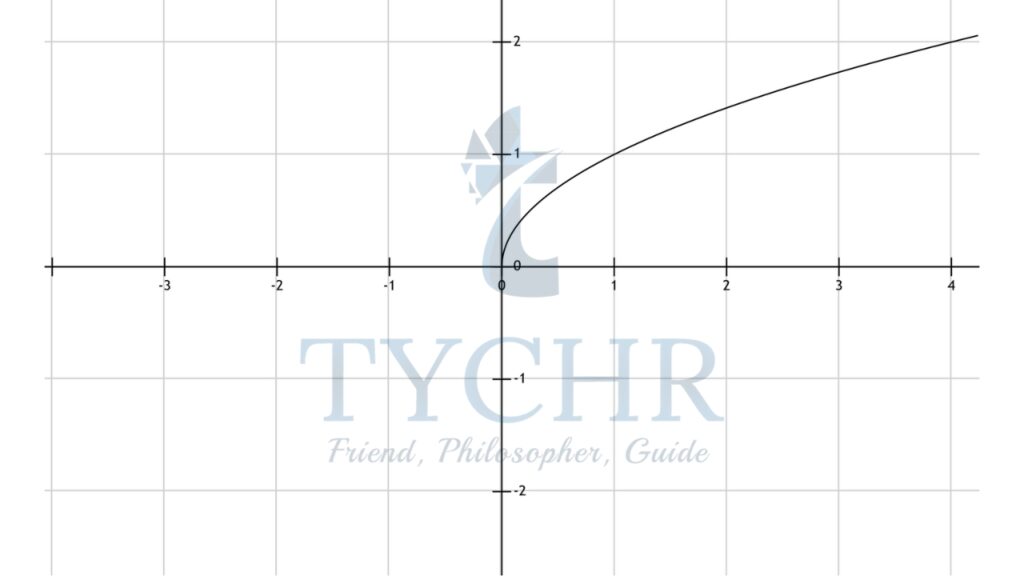
- 𝑓(𝑥) = √𝑥
- f(x)=x3
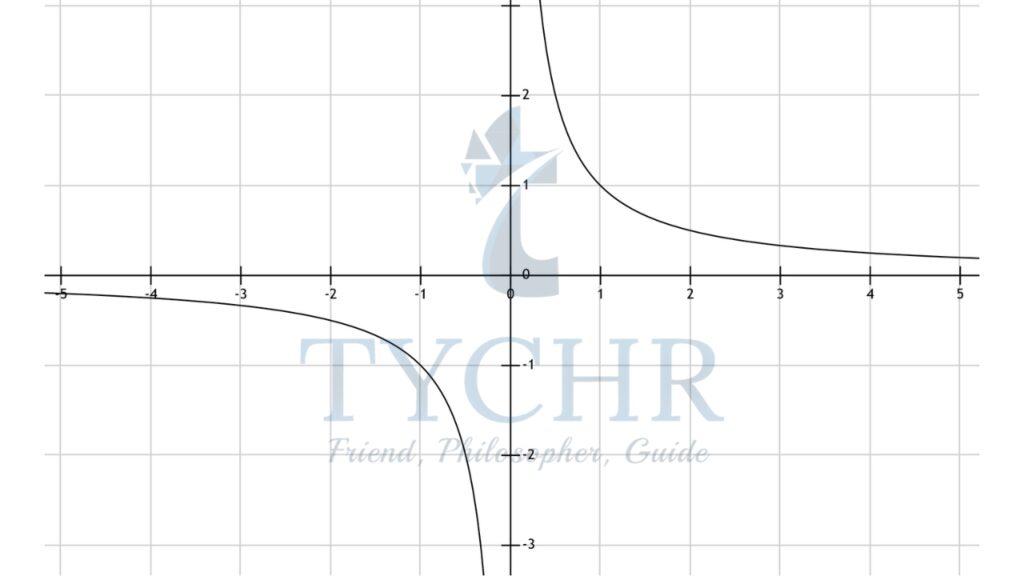
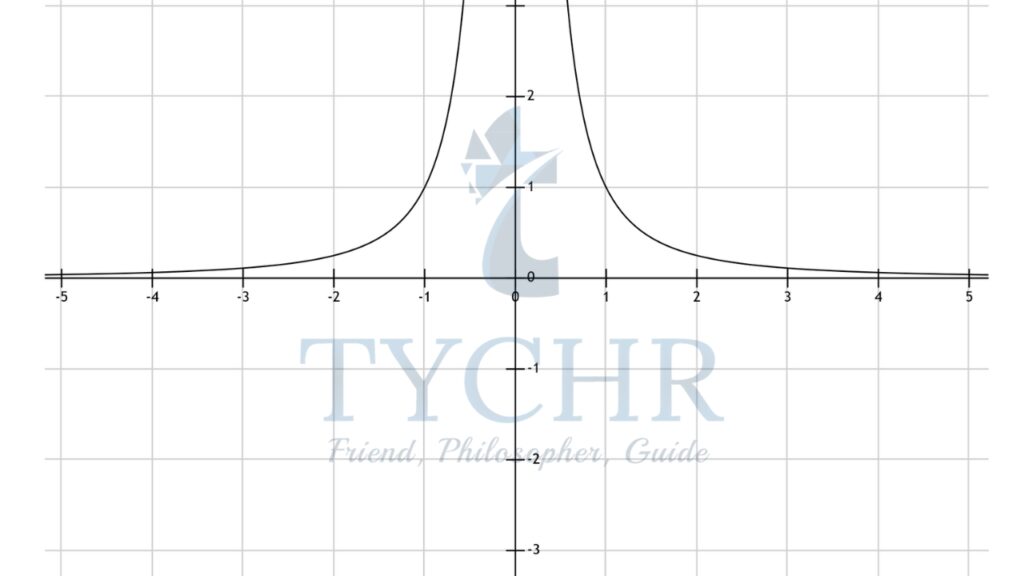
- f(x)= 1/x
- f(x) = 1/x2


II. VERTICAL AND HORIZONTAL TRANSLATIONS
- Vertical Translation:
Let f(x)=x2, g(x)=x2+3 and h(x)=x2-2
The graph of g(x) can be obtained by shifting the graph of f(x), three units up and the graph of h(x) can be obtained by shifting the graph of f(x), two units down.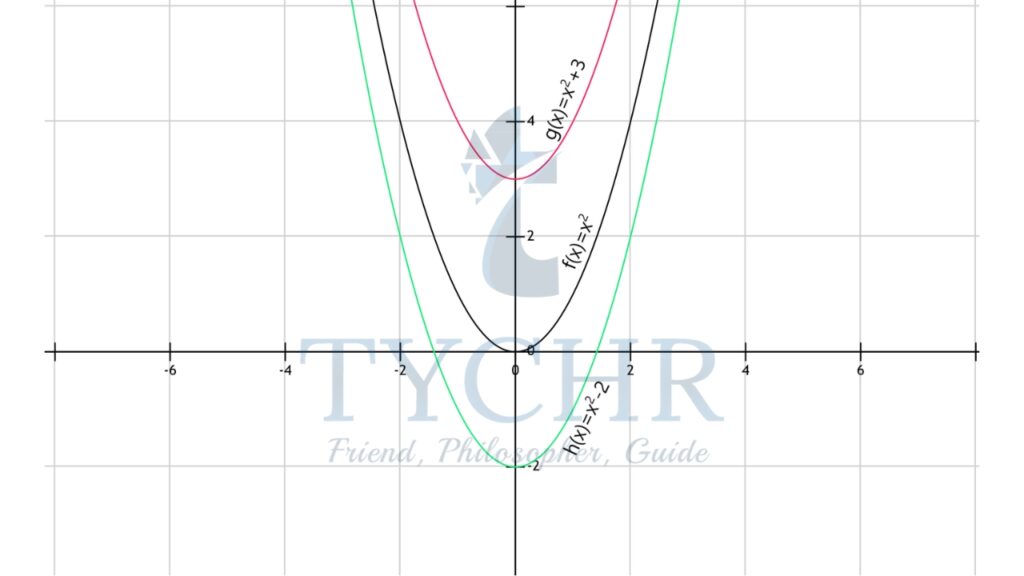
- Horizontal Translation:
Let f(x)=x2, g(x) = (x+3)2, h(x) = (x-2)2
The graph of g(x) can be obtained by shifting the graph of f(x), three units left, and the graph of h(x) can be obtained by shifting the graph of f(x), two units right.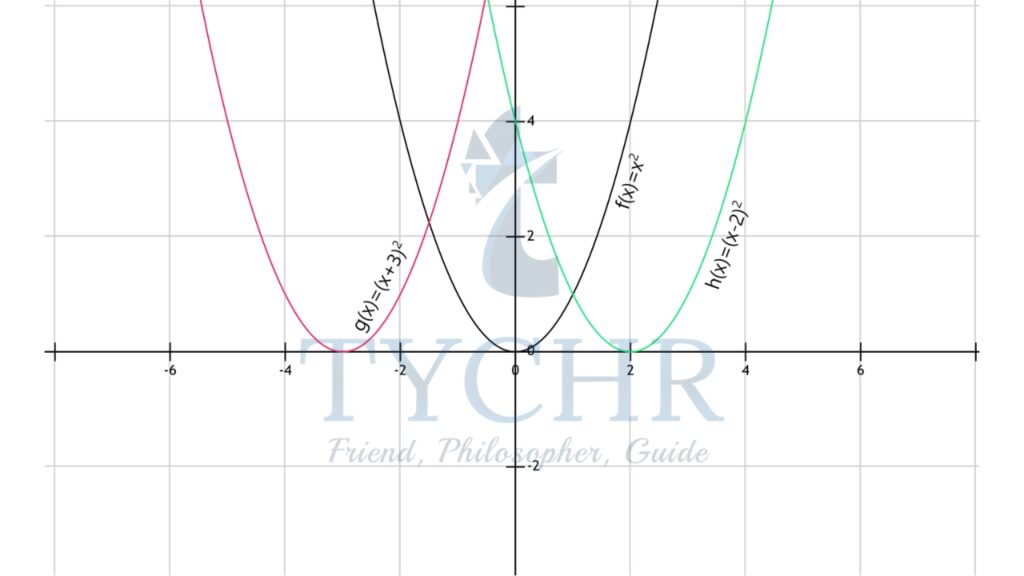


III. REFLECTIONS
- Reflection in x-axis:
Let f(x)=x2 and g(x)=-x2, then the graph of g(x) will be a reflection of f(x) in the x=axis.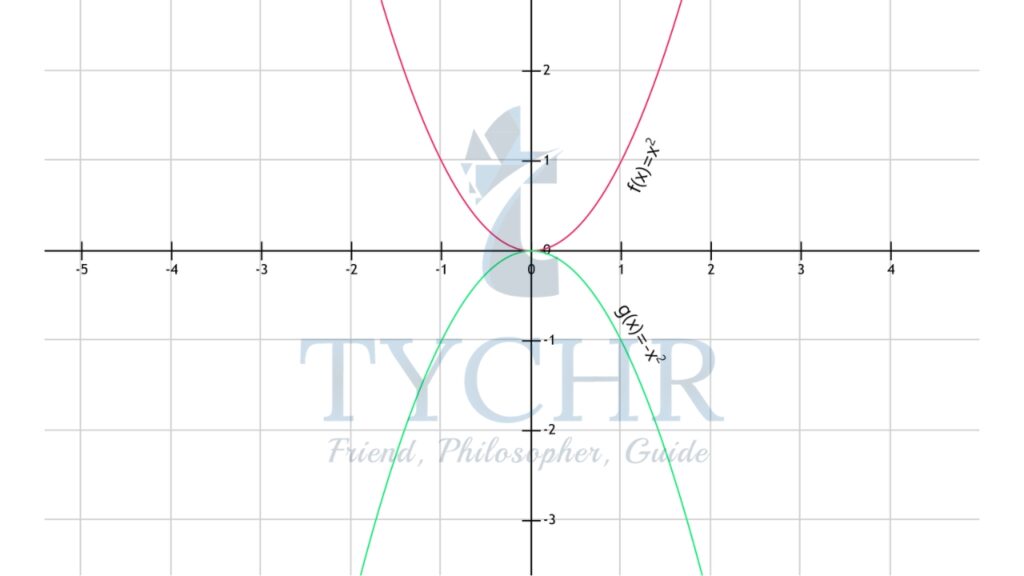
- Reflection in y-axis:
Let 𝑓(𝑥) = √(𝑥 − 2) and 𝑔(𝑥) = √(−𝑥 − 2), then the graph of g(x) will be a reflection of f(x) in the y-axis.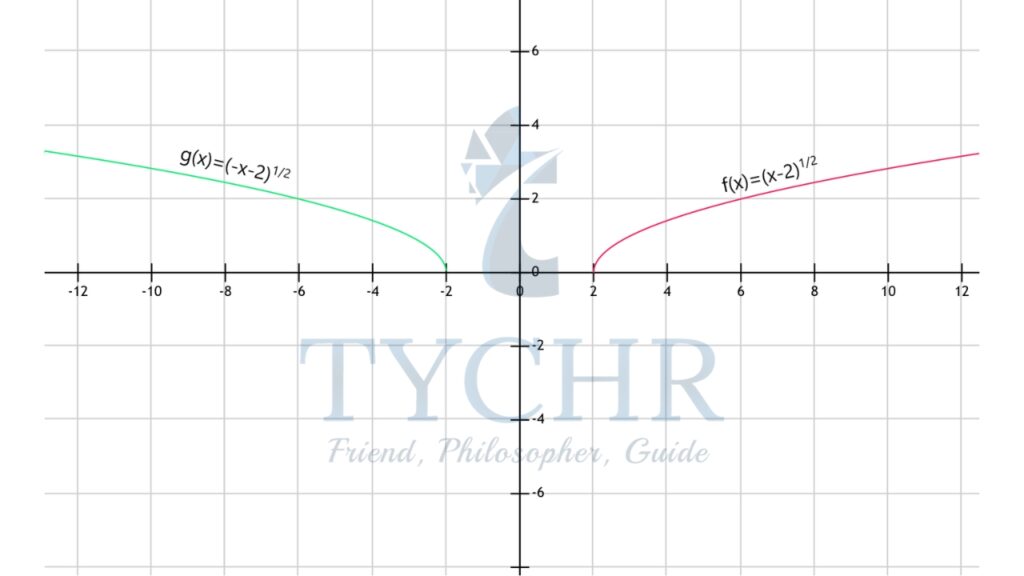


IV. STRETCHING AND SHRINKING
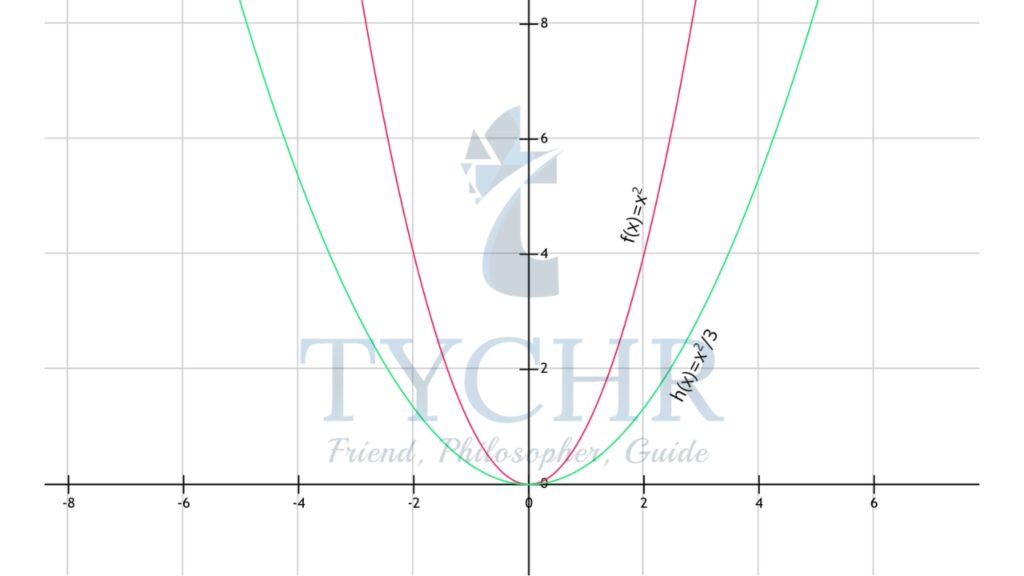
- Vertical stretch or shrink
Let f(x)=x2, g(x)=3x2 and h(x) = (1/3)x2
The graph of g(x) can be obtained by vertical stretching the graph of f(x) by a factor of 3 (scale factor 3) and the graph of h(x) can be obtained by vertically shrinking the graph of f(x) by a scale factor 1/3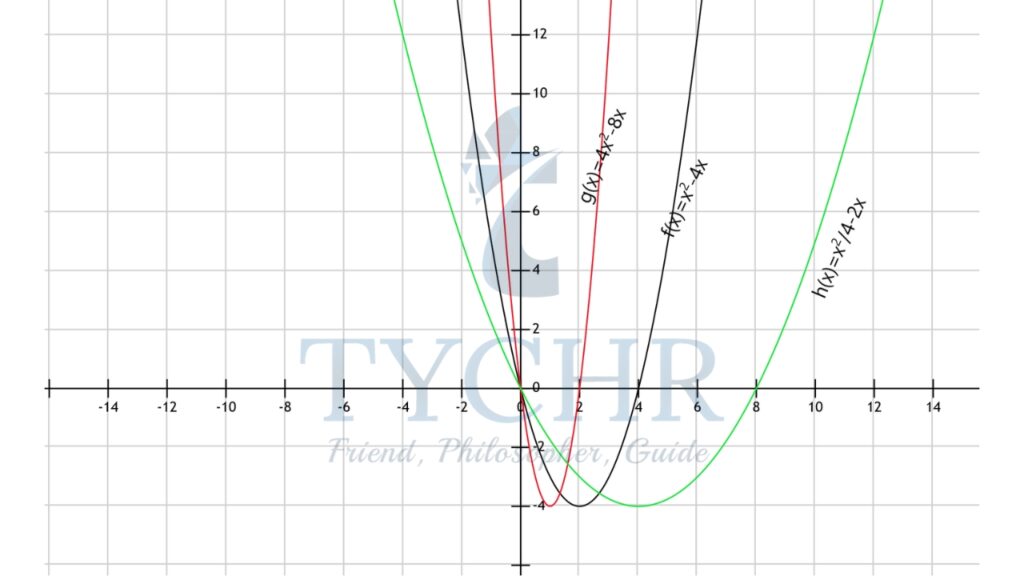
- Horizontal stretch or shrink
Horizontal stretch or shrink is done to obtain a graph of f(ax) from f(x).
Let f(x)=x2-4x, g(x)=f(2x)=4x2-8x and h(x)=f(x/2)=1/4 x2-2x.The graph of g(x) is obtained by horizontally shrinking the graph of f(x) by a scale factor 1/2 and the graph of h(x) is obtained by horizontally stretching the graph of f(x) by a scale factor of 2.


Ex. Describe the sequence of transformations performed on the graph of y=x2 to obtain the graph of y=4x2-3
Step 1: Draw the graph of y=x2

Step 2: Vertically stretch the graph of y=x2 by a scale factor of 4, to obtain the graph of y=4x2

Step 3: Vertically shift the graph of y=4x2 three units down, to obtain the graph of y=4x2-3

